present
Zarejestruj się i otrzymaj 50 $ zniżki na pierwszy zakup
Trading product for Gann_Pivot_Vision Wskaźnik Forex Signal, image 1
Gann_Pivot_Vision
Wskaźnik
1 zakupy
Wersja 1.0, Dec 2025
Windows, Mac
4.3
Opinie: 3
Trading product for Gann_Pivot_Vision Wskaźnik Forex Signal, image 2
Trading product for Gann_Pivot_Vision Wskaźnik Forex Signal, image 3
Trading product for Gann_Pivot_Vision Wskaźnik Forex Signal, image 4
Trading product for Gann_Pivot_Vision Wskaźnik Forex Signal, image 5
Od 24/10/2025
1.44M
Wolumen transakcji
6.53K
Zysk w pipsach
3
Sprzedaż
418
Bezpłatne instalacje

Opis

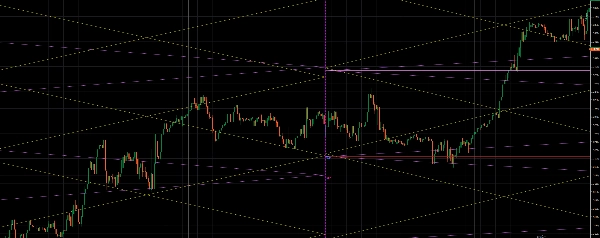
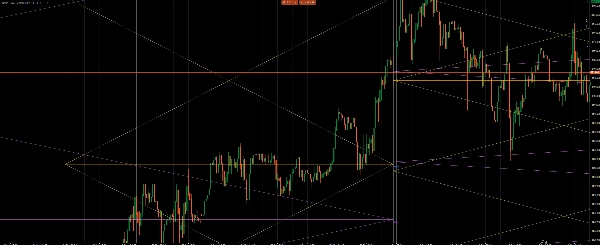
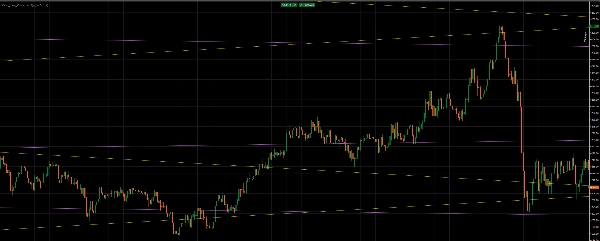
Gann Pivot Vision to innowacyjne narzędzie analityczne, które łączy klasyczne poziomy odwrócenia pivot oraz geometrię Ganna, umożliwiając traderom wizualne identyfikowanie kluczowych poziomów wsparcia/oporu oraz przewidywanie odwróceń rynku z wysoką dokładnością.

Wskaźnik automatycznie buduje:

✔ Dzienne poziomy pivot

✔ Tygodniowe poziomy pivot

✔ Miesięczne poziomy pivot


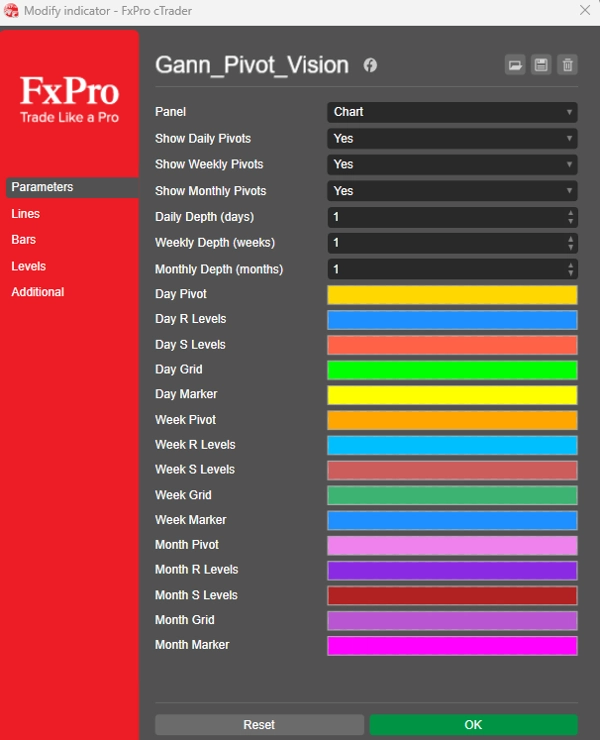
Każdy interwał czasowy jest wyświetlany z własną paletą kolorów i może być włączany lub wyłączany w razie potrzeby.

🔷 Siatka Ganna i struktura diagonalna


Dodatkowo narzędzie generuje diamentową siatkę Ganna opartą na zakresie poprzedniego okresu.:

◾ Linie diagonalne (symetria Ganna)

◾ Przecięcia geometryczne — obszary kluczowych reakcji rynku

◾ Centrum struktury = centralna cena okresu (Pivot Point)


To połączenie pozwala na:

🔹 identyfikację silnych skupisk cenowych

🔹 identyfikację obszarów prawdopodobnego odwrócenia

🔹 potwierdzanie sygnałów trendu i kontratrendu

Podsumowanie

Podsumowanie AI
Gann Pivot Vision is an indicator tool that integrates classic pivot reversal levels with Gann geometry to assist traders in identifying key support and resistance levels and forecasting market reversals. It automatically calculates and displays daily, weekly, and monthly pivot levels, each distinguished by a unique color scheme that can be toggled on or off. The tool also generates a diamond-shaped Gann grid based on the previous period's price range, featuring diagonal lines that reflect Gann symmetry and geometric intersections that highlight significant market reaction zones. The center of this structure corresponds to the central price of the period, or pivot point. This combination enables users to pinpoint strong price clusters, anticipate potential reversal areas, and validate trend and countertrend signals. The indicator supports analysis across multiple markets including Forex, indices, and stocks, and is applicable to various trading strategies such as scalping, breakout, and signal-based approaches.
Profil wskaźnika

Dyskusja

Opinie klientów

4.3
Opinie: 3
5
33 %
4
67 %
3
0 %
2
0 %
1
0 %
Opinie klientów
December 17, 2025
The opening read should not drive the only input, but the setup still needs say no.
December 12, 2025
December 10, 2025

Częste pytania

Forex
Signal
Breakout
Scalping
Indices
Stocks
Produkty dostępne za pośrednictwem cTrader Store, w tym boty handlowe, wskaźniki i wtyczki, dostarczane są przez deweloperów zewnętrznych i udostępniane wyłącznie w celach informacyjnych oraz w celu zapewnienia dostępu technicznego. cTrader Store nie jest brokerem i nie zapewnia doradztwa inwestycyjnego, nie udziela spersonalizowanych rekomendacji ani nie gwarantuje przyszłych wyników.

Więcej od tego autora

Wskaźnik
Forex
Crypto
+3
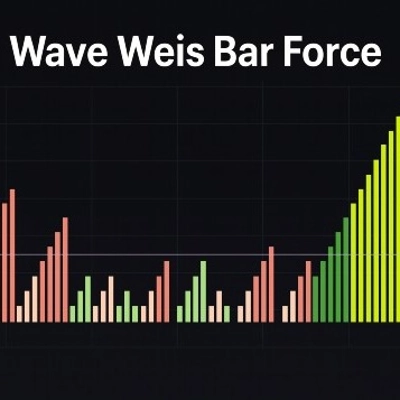
Wave Weis Bar Force - is an indicator that applies the logic of Volume waves (Weis) to determine accumulation
Wskaźnik
AI
Forex
+10
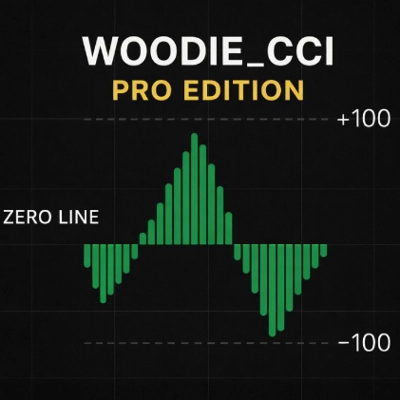
Woodie_CCI_pro is an advanced CCI-based toolkit built around the classic Woodie CCI methodology.
Wskaźnik
Forex
Crypto
+5
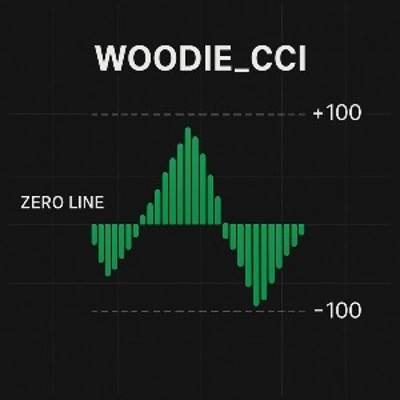
The Woodie CCI Indicator (Woodie Commodity Channel Index) is a variation of the classic CCI indicator
Wskaźnik
ATR
Forex
+6
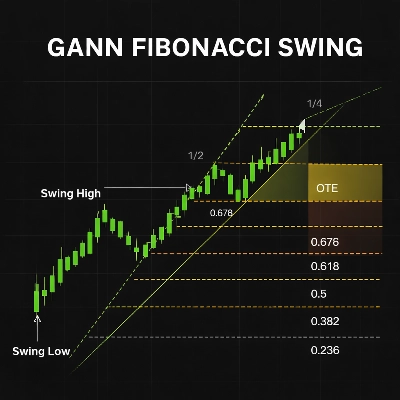
It combines swing (pivot-based) market structure detection with Gann Fan geometry and Fibonacci retracement/extension
Wskaźnik
AI
Forex
+13
SigmaTrend Oscillator is an advanced momentum-based trend identification tool that combines dynamic price
cBot
CCI
RSI
+5
Advanced multi-strategy cBot with 30+ signal modules, risk control, sessions, filters and automated trade management.
8.1%
ROI
2
Współczynnik zysku
Wskaźnik
ATR
SMC
+9
The Wyckoff Schematic Indicator is a professional-grade market structure tool designed to automatically detect

Możesz także polubić

Wskaźnik
Pin Bar
Inside Bar
+2
Advanced candlestick pattern recognition with structural quality scoring, alerts and adaptive chart visuals.
Wskaźnik
ATR
RSI
+6
💹 Define a price channel 📈 and determine trend direction (bullish 🟢 or bearish 🔴).
Wskaźnik
AI
ATR
+27
Trade the Trend Flip. Control the Risk. 🎯📈”
Wskaźnik
ATR
BTCUSD
+5
Trailing algo 📈 auto-tracks trends 🎯 adapts to volatility 🌟 precise moves 🛡️ retest signals 🚀 no lag, smart market
Wskaźnik
RSI
XAUUSD
+2
Automatic ZigZag swings with dynamic support & resistance levels, labeling highs/lows for clear trend signals.
Wskaźnik
Forex
Multi-timeframe candlesticks!
Logo „Index Hunter”
Najwyżej oceniane
4.7
(4)
$20
/
$40
Wskaźnik
AI
ATR
+9
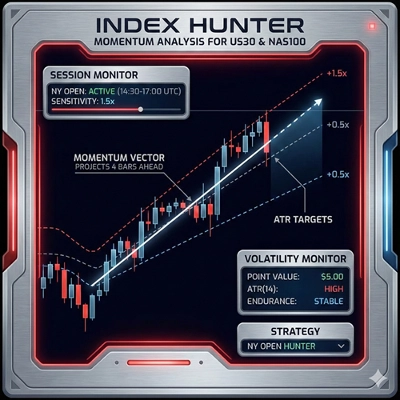
Index Hunter: Momentum analysis for US30 & NAS100. Designed to identify high-velocity moves and intraday trends.
Wskaźnik
Prop
Forex
+5
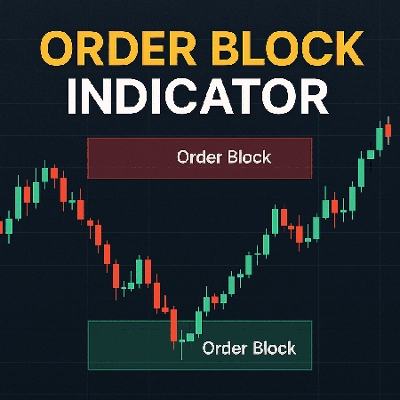
🎯 Order Block Detector - Smart Trading: Identifica bloques de órdenes clave en cTrader para un trading más inteligente.
Wskaźnik
Prop
Forex
+2
⚔️ JPY Samurai Breakout Pro — Professional Breakout Indicator for cTrader ⚔️
Wskaźnik
Laser entries with pivot confirmation. No repaint, all timeframes. Professional results.
Wskaźnik
ATR
Wedge
+2
Strong Supertrend Turn Market Movement into a Clear Map Market analysis
Wskaźnik
Forex
BTCUSD
+5
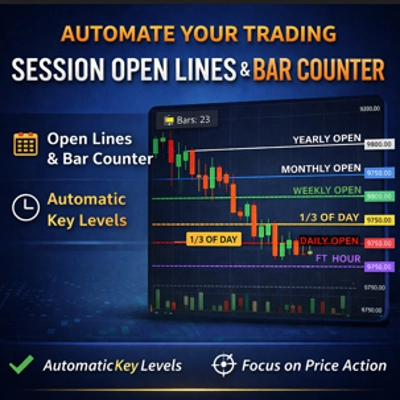
Auto-plots Open, High, and Low of Day/Week/Month/Year. Session candle counter + Round Numbers. Fully customizable
Wskaźnik
Forex
Crypto
Bar Close Alert Manager provides real-time alerts for bar closures with customizable notifications and automation.
Wskaźnik
RSI
RSI on the main chart with 45/55 momentum levels, overbought/oversold levels, averaged RSI, and multi-timeframe support.
Wskaźnik
ATR
RSI
+1
Super Trend Rsi ,ATR + trend change distance + dynamic Alpha, divergence/convergence
Wskaźnik
ADX
ATR
+2
GOLD SENTINEL v1.0 - A CANDLE-COLORING INDICATOR FOR GOLD.
Wskaźnik
VWAP
Support & Resistance
Trading.FC$_vwap Algo shows VWAP trends, dynamic support/resistance and deviation bands to spot potential trade entries.
Logo „KANDIKA HEAT MAP”
Najwyżej oceniane
4.6
(5)
$19
Wskaźnik
Color-Based Market Pressure & Volatility Visualizer The Kandika Heatmap Indicator

Cena

Od 24/10/2025
1.44M
Wolumen transakcji
6.53K
Zysk w pipsach
3
Sprzedaż
418
Bezpłatne instalacje