Description
English – Description
VWAP Bands Indicator for cTrader
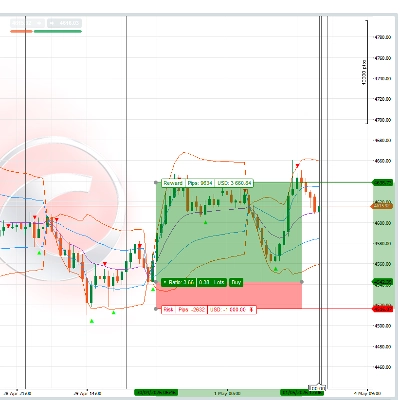
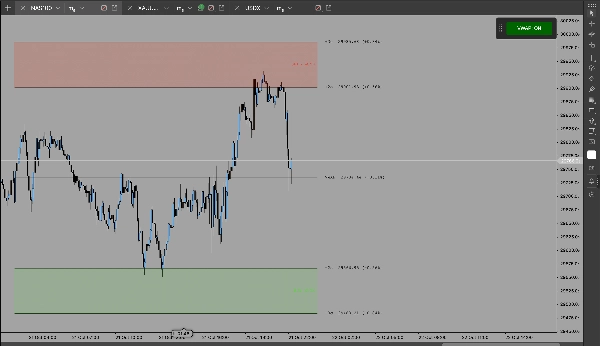
This indicator displays the Volume Weighted Average Price (VWAP) along with three upper and three lower standard deviation bands to help traders analyze price movements, market volatility, and potential trading areas.
Key Features
- VWAP Line: Displays the Volume Weighted Average Price as a reference for the market's average traded price, weighted by volume.
- Three Standard Deviation Bands: Shows three levels above and below the VWAP to help identify price extensions and potential reversal or continuation areas.
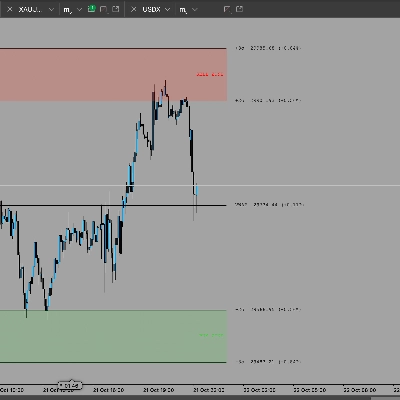
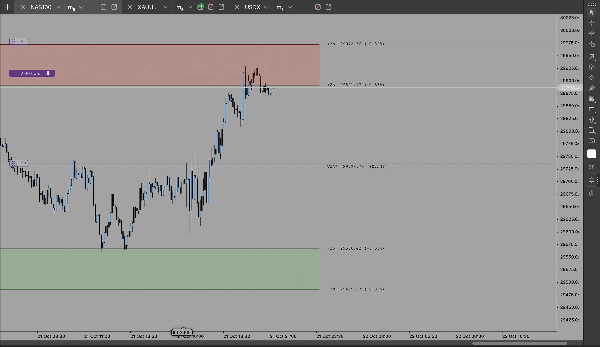
- Buy and Sell Zones: Highlights potential buying and selling areas based on the indicator's VWAP and band calculations.
- Price and Percentage Information: Displays relevant price levels and percentage distances to support market analysis.
- Customizable Settings: Allows users to adjust the indicator's parameters to suit their trading preferences.
- Draggable ON/OFF Button: Easily enables or disables the entire indicator directly from the chart. The button can be moved to a preferred location.
- Labels Enabled by Default: Price labels and indicator information are displayed by default, where supported by the selected settings.
How to Use
Use the VWAP line and deviation bands as analytical reference points to evaluate price positioning, volatility, and possible areas of interest. The highlighted zones may help identify potential trading opportunities, but they should be assessed alongside other market information and appropriate risk management.
The indicator is intended as a technical analysis aid. It does not automatically guarantee profitable entries or exits and should not be treated as a standalone trading system.
Risk Disclaimer: This indicator is provided for informational and educational purposes only. It does not guarantee profits or prevent losses. Trading financial markets involves risk, and you are responsible for your own trading decisions. Use this indicator as a support tool for market analysis, not as a guarantee of trading results.