Description
SigmaTrend Oscillator est un outil avancé d'identification de tendance basé sur le momentum qui combine le mouvement dynamique des prix avec un filtrage de volatilité basé sur le sigma.
Il révèle les changements dans la force de la tendance, les phases du marché et les retournements potentiels avant qu'ils n'apparaissent sur le graphique des prix.
Parfait pour synchroniser les entrées, les sorties et filtrer le bruit du marché.
🔥 Caractéristiques clés
CaractéristiqueAvantage
Moteur de momentum adaptatif
Comportement intelligent dans toutes les conditions de marché
Filtre de volatilité Sigma (σ)
Élimine le bruit — conserve les vrais signaux
Structure d'amplitude à double couche
Identifie le momentum et la phase du marché
Cartographie dynamique des couleurs
Reconnaissance visuelle instantanée de la tendance
Détection des retournements & continuations
Meilleur timing des transactions
Équilibre sur la ligne zéro
Alignement directionnel clair
Fonctionne sur tous les marchés & toutes les périodes
Très universel
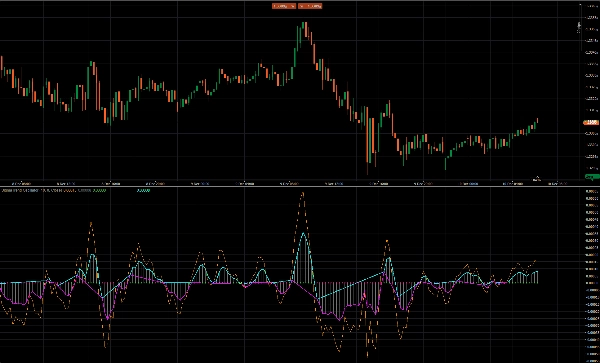
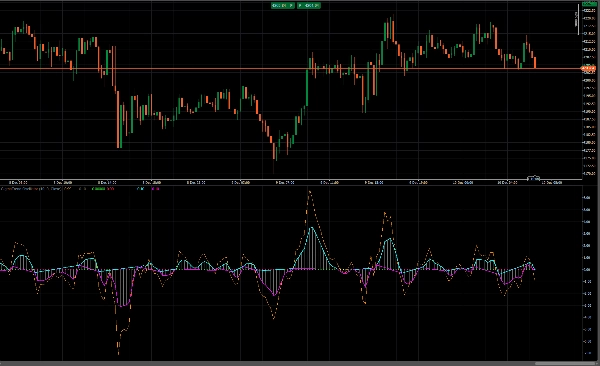
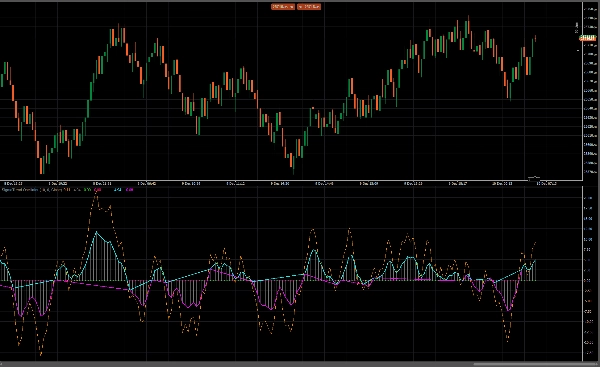
📈 Structure visuelle — Ce qu'il dessine
L'oscillateur comprend deux composants visuels principaux :
1️⃣ Ligne d'onde de tendance
Onde dynamique principale du momentum
- 🔵 Bleu → force de la tendance haussière
- 🔴 Rouge → pression baissière
- 🟪 Teinte neutre → accumulation / impulsion faible
2️⃣ Marqueurs d'impulsion Sigma
Impulsion de signal de précision
- 🎯 Montre les points clés de retournement
- ⚡ Met en évidence le momentum de cassure
- 🔍 Marque les expansions & compressions de volatilité
🎯 Signaux de trading
ÉvénementSignification du trading
L'onde croise au-dessus de zéro
🔵 Début potentiel d'une tendance d'achat
L'onde croise en dessous de zéro
🔴 Début potentiel d'une tendance de vente
Changement de couleur après un pic extrême
🎯 Confirmation de retournement
L'onde se redresse après un repli
🚀 Continuation de la tendance
Réduction de l'impulsion
🟡 Consolidation / faible volatilité
Expansion de l'impulsion
🔥 Cassure / forte tendance
💡 Meilleure utilisation pour
- Scalping & Intraday
- Swing Trading
- Suivi de tendance avec confirmations claires
- Stratégies de retournement
- Filtrage des fausses cassures
- Amélioration du ratio risque/rendement grâce au timing
Marchés supportés :
✔ Forex
✔ Crypto
✔ Métaux
✔ Indices
✔ Actions
Résumé
Key features include an adaptive momentum engine that adjusts to various market conditions, a sigma volatility filter to reduce noise and highlight true signals, and a dual-layer amplitude structure for identifying momentum and market phases. The indicator uses dynamic color mapping for instant visual recognition of trends and includes reversal and continuation detection for improved trade timing. It operates on a zero-line balance to provide clear directional alignment and is applicable across all markets and timeframes.
Visually, the oscillator displays two main components: the Trend Wave Line, which shows bullish (blue), bearish (red), and neutral (shaded) momentum; and Sigma Pulse Markers, which indicate key reversal points, breakout momentum, and volatility expansions or squeezes.
Trading signals include wave crossings above or below zero for potential buy or sell trends, color flips for reversal confirmation, wave recoveries for trend continuation, and pulse narrowing or expansion to signal consolidation or breakout phases.
The SigmaTrend Oscillator supports multiple markets including Forex, Crypto, Metals, Indices, and Stocks, and is suitable for scalping, intraday, swing trading, trend following, reversal strategies, and filtering false breakouts.
Avis clients
5 | 100 % | |
4 | 0 % | |
3 | 0 % | |
2 | 0 % | |
1 | 0 % |