
الوصف
▁▂▃▄▅▆▇ █ أكثر من 10,000 متداول (مؤسسي + تجزئة) █ ▇▆▅▄▃▂▁
- اختر مؤشراتنا الأفضل في cTrader 🏆
- ✨ دقة حصرية لنتائج متفوقة ✨
- 📈 خوارزمياتنا — مع أفضل المرئيات تقييمًا 🎯—
- تم تنفيذها بنجاح في صندوقين كميين
▁▂▃▄▅▆▇ █████████████████████████████ ▇▆▅▄▃▂▁
_______________________________________________
_______________________________________________
📌 مؤشرات هيكل السوق
· ✅ هيكل السوق المتقدم: Bos, Choch, SwinLevels, كتل الأوامر، هيكل السوق & مكتشف السيولة
· 🔄 تحليل هيكل السوق الديناميكي لنقاط التحول
· 🧱 كتلة الأوامر
· ⚖️ اختلال السوق
· ⛓️ BOS & CHOCH
· 🧠 قوة ICT 3
______________________________________________________________-
تخزين cBots : 🧠 اختراق الذهب و BTCمحاور الجلسة 🧠
_______________________________________________
🔚 أنظمة الخروج الذكية
_______________________________________________
📐 مؤشرات ZigZag
· ➖ ZigZag
_______________________________________________
🧱 مؤشرات الدعم والمقاومة
· 🟩 خطوط دعم ومقاومة SmartTrend
· 🧱 جميع مستويات الدعم والمقاومة
_______________________________________________
📊 مؤشرات الاتجاه والقناة
· 📊 سوبرتريند
· ⭐ قناة SSL المميزة
_______________________________________________
💧 أدوات الحجم والسيولة
· 📉 خريطة تصفية الرافعة المالية
_______________________________________________
⚡ مؤشرات الزخم و RSI
· 📈 مُشغل اتجاه RSI
· 🔎 متعقب ميل الشمعة متعدد المستويات
_______________________________________________
🔮 أدوات التنبؤ والإسقاط
· 📐 التنبؤ بناءً على Linreg& ATR
· 📏 انحدار فيبوناتشي الخطي متعدد الأطر الزمنية
· 📈 عارض تدفق السوق المدعوم بالحجم
______________________________________________________________________________________________________
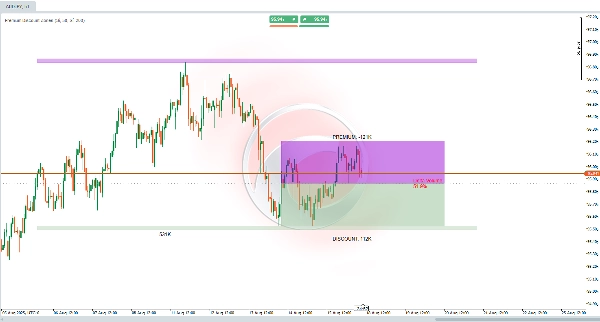
ما الذي يفعله مؤشر مناطق الخصم المميزة؟ 🎯
تم تصميم هذا المؤشر لمساعدتك على تحديد المناطق الرئيسية استنادًا إلى أعلى وأدنى مستويات السوق الأخيرة. يقوم بتحليل فترة قابلة للتكوين من الأشرطة الماضية لتحديد نطاق سعري عام، ويحسب توازن النقطة الوسطى، ويقسم هذا النطاق إلى منطقتين رئيسيتين:
- 🔺 المميزة (المنطقة العليا)
- 🟩 الخصم (المنطقة السفلى)
كما يقيم حجم التداول في تلك الأشرطة لحساب "دلتا الحجم"، والتي تمثل نسبة الحجم المرتبط بالحركات الهبوطية.
ما الغرض منه؟ 💡
يساعدك هذا المؤشر على اكتشاف المناطق التي قد يكون السعر فيها:
- 📈 مبالغ في قيمته (منطقة المميزة) → احتمال البيع أو جني الأرباح
- 📉 منخفض القيمة (منطقة الخصم) → احتمال الشراء أو التراكم
يوفر عرضًا سريعًا لـ اختلالات السوق، مبرزًا ما إذا كان الحجم الأخير يدعم التحركات الصعودية أو الهبوطية. كما أن المناطق الهيكلية الممتدة تُظهر مستويات رئيسية تتجاوز النطاق الفوري، مفيدة لتخطيط التداولات في الاتجاهات أو الانعكاسات. 🚀
مثالي للاستراتيجيات التي تستهدف نطاقات التوحيد، الاختراقات، التداول المؤسسي، أو تحليل السيولة!
كيف تفسره؟ 🔍
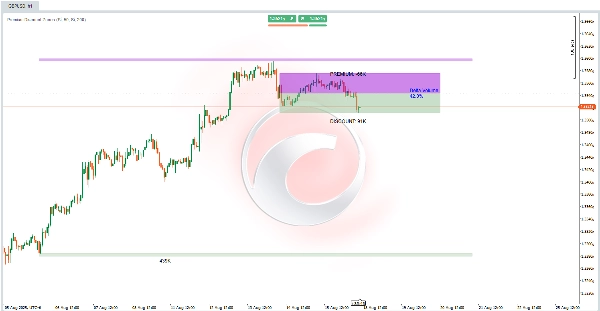
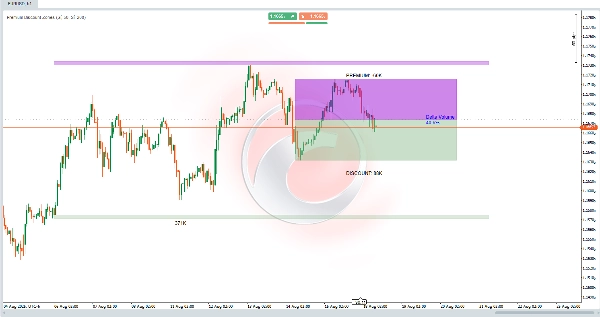
- 🟣 منطقة المميزة (بنفسجي، فوق التوازن) → النطاق العلوي، حيث يُعتبر السعر "باهظًا."
- 🟢 منطقة الخصم (أخضر، تحت التوازن) → النطاق السفلي، حيث يُنظر إلى السعر على أنه "رخيص."
- ⚖️ خط التوازن (رمادي، في الوسط) → يحدد نقطة منتصف النطاق، ويعمل كمستوى توازن. قد يشير عبور السعر هنا إلى تغيير في التحيز.
- 📊 دلتا الحجم (الوسط) → تُظهر نسبة حجم الهبوط (🔴 >50% = هبوطي، 🔵 <50% = صعودي).
- 🏛 المناطق الهيكلية (امتدادات مظللة) → مناطق ممتدة فوق/تحت حدود النطاق، تعمل كـ دعم/مقاومة طويلة الأمد مع هامش أمان بناءً على حركة السعر الأخيرة.
يقوم المؤشر بـ تحديث ديناميكي لهذه المناطق على الأشرطة الأخيرة، ويمتد يمينًا للإسقاطات المستقبلية.
كيف تستخدمه في التداول؟ 🛠️
- الإعداد الأولي:
-
- تفعيل مستويات PD (الرئيسية) و المناطق الهيكلية إذا رغبت.
- ضبط فترات النظر للخلف:
-
- قصيرة (مثلاً، 50 شريط) → النطاقات الأخيرة
- طويلة (مثلاً، 200 شريط) → السياق الهيكلي
- تحليل الرسم البياني (مثلاً، إطار زمني H1):
-
- تحقق مما إذا كان السعر في 🟣 المميزة (اعتبر البيع مع تأكيد هبوطي) أو 🟢 الخصم (اعتبر الشراء مع تأكيد صعودي).
- استخدم دلتا الحجم للتأكيد:
-
- 🔴 >50% → يفضل القصير في المميزة
- 🔵 <50% → يفضل الطويل في الخصم
- استراتيجيات الدخول والخروج:
-
- 🟢 الشراء في منطقة الخصم: إذا دخل السعر المنطقة الخضراء وكانت دلتا منخفضة، ابحث عن دخول طويل مع وقف خسارة تحت أدنى المنطقة وأهداف عند التوازن أو المميزة.
- 🟣 البيع في منطقة المميزة: إذا وصل السعر إلى المنطقة البنفسجية وكانت دلتا مرتفعة، فكر في القصير مع وقف خسارة فوق أعلى المنطقة وأهداف عند التوازن أو الخصم.
- 🏛 استخدم المناطق الهيكلية للتداولات طويلة الأمد، مع تطبيق الهامش كحد خطأ.
الملخص
The indicator also computes a Volume Delta, representing the percentage of volume associated with bearish movements, which helps confirm market bias: values above 50% favor bearish conditions, while values below 50% favor bullish conditions. Extended structural zones project key support and resistance levels beyond the immediate range, useful for planning trades in trending or reversal markets.
Users can adjust lookback periods to focus on recent ranges or broader structural context. The indicator dynamically updates these zones and extends them forward for future projections. It supports trading strategies involving consolidation ranges, breakouts, institutional trading, and liquidity analysis by providing visual cues on price valuation and volume-driven market imbalances.


