

설명
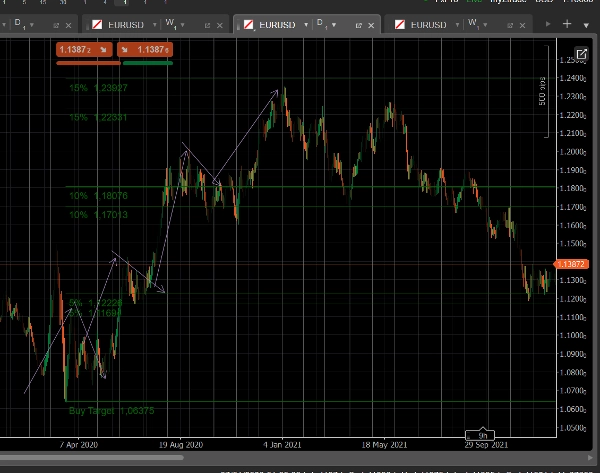
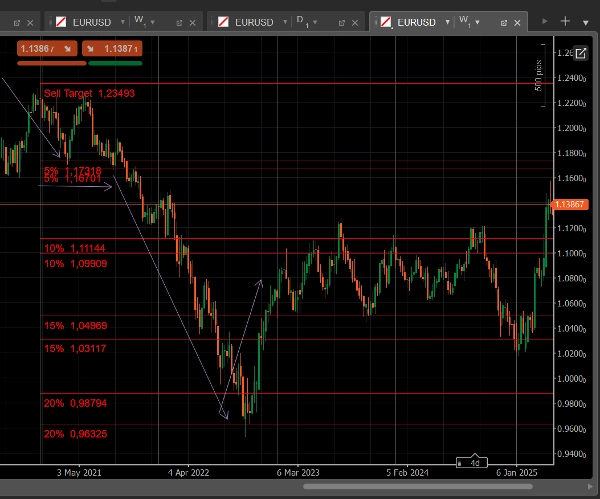
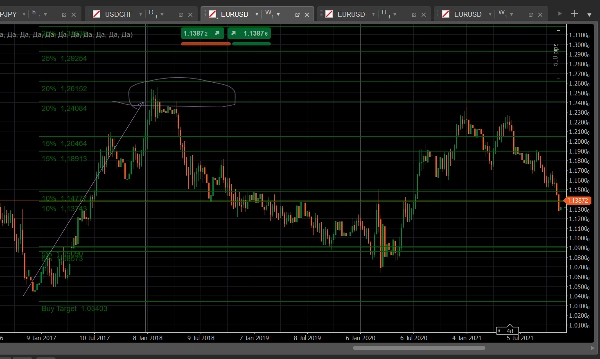
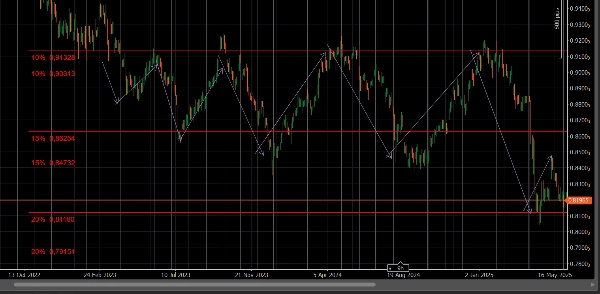
MyZtrade MM 레벨은 시장 조성자가 가격을 반전시키는 정확한 지점인 중요한 스윙의 고점과 저점에서 가격 구역을 만듭니다. 완전 자동 구역 대신, 사용자가 극단점을 직접 선택하면 지표가 해당 지점에서 잠재적 반전 및 조정 구역을 직접 투영합니다.
작동 방식:
- 구역을 만들고자 하는 캔들의 고점 또는 저점 근처를 클릭하세요.
- 해당 지점에서 넓은 범위의 구역을 만들려면 Q를 누르세요.
- 같은 지점에서 더 세밀하고 정밀한 구역을 만들려면 W를 누르세요.
- 모든 구역에는 정확한 가격이 표시되어 수동 계산이 필요 없습니다.
도움이 되는 이유:
- 핵심 고점/저점에서 조정 또는 반전이 도달할 수 있는 위치를 즉시 시각화하여 직접 계산할 필요가 없습니다.
- 두 개의 독립적인 구역 세트 — 차트를 빠르게 읽기 위한 세트와 정밀한 매핑을 위한 세트.
- 각 구역은 개별적으로 켜거나 끌 수 있어 차트에 필요한 정보만 표시됩니다.
깔끔한 작업 흐름을 위해 설계됨:
- 그룹 삭제: 구역 세트(매수 또는 매도)에서 한 줄을 제거하면 전체 세트가 한 번에 사라져 수동 차트 정리가 필요 없습니다.
- 구성 가능한 선 스타일(점선/실선)과 매수 및 매도 구역에 대한 별도의 색상.
- 단일 가격 지점 대신 범위로 작업하는 트레이더를 위한 선택적 쌍선.
대상 사용자: 핵심 고점과 저점을 기준으로 작업하며 계산기로 전환하지 않고 잠재적 반전 또는 조정 구역을 빠르게 매핑하고자 하는 트레이더.
요약
AI summary
MyZtrade MM Levels v1.2 is a trading indicator designed to identify potential market maker reversal and correction zones based on key price extremes. Users manually select a significant high or low on the chart, then generate price zones projecting where corrections or reversals may occur. The indicator offers two zone sets: a broad set for quick analysis (activated by pressing Q) and a finer, more precise set (activated by pressing W). Each zone is clearly labeled with its exact price level, eliminating the need for manual calculations.
Key features include individual toggling of zones for customized chart views, group deletion of entire zone sets for efficient cleanup, configurable line styles and colors distinguishing Buy and Sell zones, and optional paired lines for range-based trading. The tool supports analysis based on classical support and resistance concepts and integrates elements related to Fibonacci, order blocks, supply and demand, liquidity grabs, and premium/discount zones.
MyZtrade MM Levels is intended for traders who focus on key highs and lows to quickly map potential reversal or correction areas without additional calculations, facilitating a streamlined workflow and enhanced chart clarity.
Key features include individual toggling of zones for customized chart views, group deletion of entire zone sets for efficient cleanup, configurable line styles and colors distinguishing Buy and Sell zones, and optional paired lines for range-based trading. The tool supports analysis based on classical support and resistance concepts and integrates elements related to Fibonacci, order blocks, supply and demand, liquidity grabs, and premium/discount zones.
MyZtrade MM Levels is intended for traders who focus on key highs and lows to quickly map potential reversal or correction areas without additional calculations, facilitating a streamlined workflow and enhanced chart clarity.
지표 프로필
지표 카테고리
지지 및 저항
출력 유형
시각화
데이터 요구 사항
막대만
지원되는 신호
돌파
반전
레벨 터치
레벨 돌파
고객 리뷰
0.0
리뷰: 0
고객 리뷰
이 상품에 대한 리뷰가 아직 없습니다. 이미 사용해 보셨나요? 다른 사람들에게 가장 먼저 소개해 주세요!
상담
자주 묻는 질문(FAQ)
Fibonacci
Premium/Discount
Order Block
Supply & Demand
Channel
Liquidity Grab
Support & Resistance
트레이딩 봇, 지표, 플러그인 등 cTrader Store에서 제공되는 상품은 제3자 개발자에 의해 제공되며, 이는 단순히 정보 및 기술적 접근을 목적으로 제공된 것입니다. cTrader Store는 중개인이 아니며, 투자 조언, 개인별 추천 또는 향후 성과에 대한 어떠한 보장도 제공하지 않습니다.
이 작성자의 상품 더 보기















!["[Stellar Strategies] Market Session Ultimate" 로고](https://cdn.ctrader.com/image/webp/61ffd537-0125-4246-9e72-42eca1791d64_28232)





가격

가입일 28/06/2025