
설명
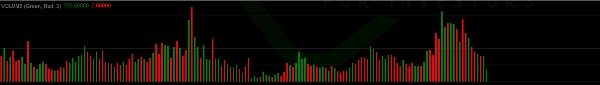
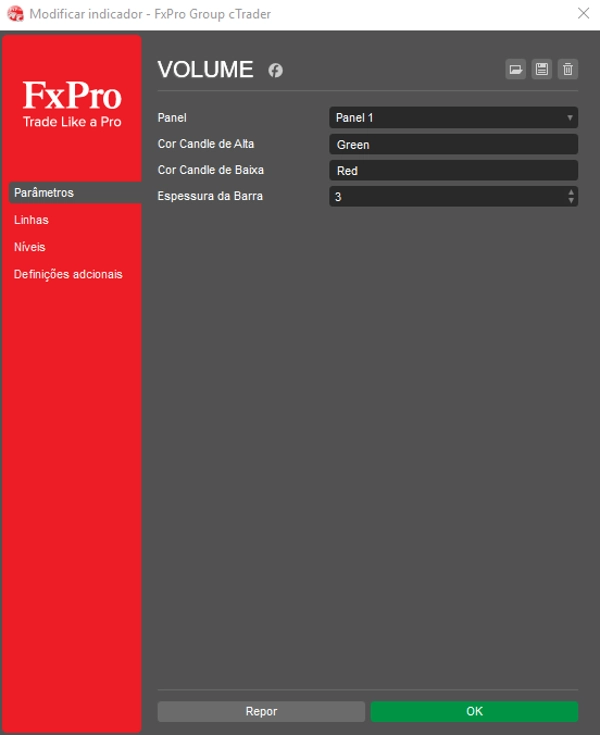
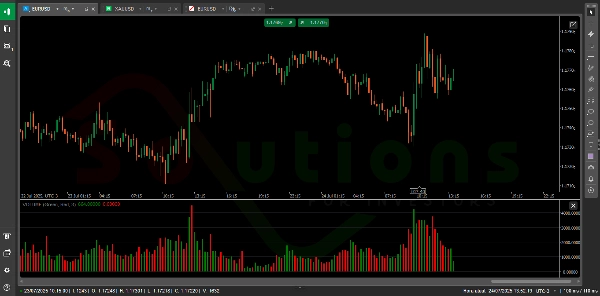
VolumeColorBar는 캔들 방향에 따라 색상으로 구분된 막대를 사용하여 시장 거래량을 시각적으로 나타내는 강력한 도구입니다. 녹색 막대는 강세 캔들(매수 압력)의 거래량을 나타내고, 빨간색 막대는 약세 캔들(매도 압력)의 거래량을 반영합니다. 이를 통해 트레이더는 시장 활동이 매수자에 의해 더 주도되는지, 매도자에 의해 더 주도되는지를 즉시 평가할 수 있어 돌파 확인, 반전 식별, 거래 타이밍 향상에 더 큰 신뢰를 가질 수 있습니다.
요약
AI 요약
VolumeColorBar is a trading indicator that visualizes market volume using color-coded bars aligned with candle direction. It displays green bars for volume on bullish candles, indicating buying pressure, and red bars for volume on bearish candles, indicating selling pressure. This visual representation helps traders quickly assess whether market activity is dominated by buyers or sellers. The indicator supports various markets and symbols, including Forex pairs (EURUSD, GBPUSD, NZDUSD, USDJPY), cryptocurrencies (BTCUSD, crypto), commodities (XAUUSD, gold, oil, silver), indices (NAS100, SP500, DAX, Dow), and stocks. By providing immediate insight into volume dynamics relative to price movement, VolumeColorBar aids in confirming breakouts, identifying potential reversals, and improving trade timing decisions.
지표 프로필
고객 리뷰
4.3
리뷰: 3
5 | 33 % | |
4 | 67 % | |
3 | 0 % | |
2 | 0 % | |
1 | 0 % |
고객 리뷰
April 14, 2025
Clean tool for workflow for a more controlled workflow. It helps with planning entries around the first range, but false breaks still need filtering. I would track 20 market opens, the first 30 to 60 minutes and a target near 1.5R. I would still keep manual review in the process.
April 13, 2025
April 13, 2025
Worth a closer look around opening range breakouts. The useful part is planning entries around the first range, with the numbers checked before scaling. The setup should be tested across at least 15 sessions because 2 or 3 fakeouts can change the picture. The trade idea is clear, but it needs a hard stop and a defined breakout rule.
상담
자주 묻는 질문(FAQ)
BTCUSD
Forex
Signal
Breakout
Indices
EURUSD
Commodities
GBPUSD
NZDUSD
Prop
Crypto
Stocks
XAUUSD
NAS100
USDJPY
트레이딩 봇, 지표, 플러그인 등 cTrader Store에서 제공되는 상품은 제3자 개발자에 의해 제공되며, 이는 단순히 정보 및 기술적 접근을 목적으로 제공된 것입니다. cTrader Store는 중개인이 아니며, 투자 조언, 개인별 추천 또는 향후 성과에 대한 어떠한 보장도 제공하지 않습니다.
이 작성자의 상품 더 보기


가격
가입일 05/02/2025
31
판매