
Keylevels v1.1
Indicador
1 compras
Versión 1.0, Nov 2025
Windows, Mac
5.0
Valoraciones: 1
Descripción
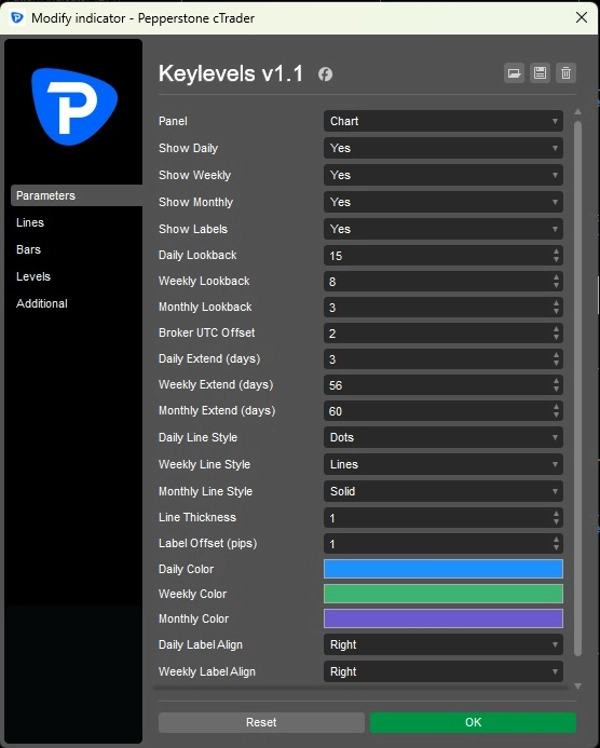
El Indicador de Niveles Clave es una herramienta de precisión diseñada para traders profesionales que exigen claridad, disciplina y control en su flujo de trabajo. Construido con una lógica estricta de retroceso y manejo del desfase horario UTC del bróker, asegura que los máximos y mínimos diarios, semanales y mensuales se tracen exactamente como los siguen los escritorios institucionales.
Las características clave incluyen:
- Control del desfase horario UTC del bróker para una alineación precisa de la sesión entre diferentes servidores.
- Estilos de línea separados por nivel (Diario, Semanal, Mensual) para una distinción visual clara.
- Alineación personalizada de etiquetas (Izquierda, Centro, Derecha) para evitar superposiciones y mantener la legibilidad del gráfico.
- Aplicación estricta del retroceso con limpieza completa de niveles obsoletos.
- Diseño minimalista y sin desorden con colores configurables, grosor y desplazamientos de etiquetas.
Este indicador está diseñado para velocidad, precisión y claridad en el flujo de trabajo. Ya sea que estés mapeando niveles institucionales o refinando tu propio proceso técnico, ofrece una solución robusta y personalizable que mantiene tus gráficos limpios y tu toma de decisiones aguda.
Resumen
Perfil del indicador
Valoraciones de clientes
5.0
Valoraciones: 1
5 | 100 % | |
4 | 0 % | |
3 | 0 % | |
2 | 0 % | |
1 | 0 % |
Conversación
Preguntas frecuentes
Forex
Signal
Breakout
Indices
EURUSD
Commodities
GBPUSD
NZDUSD
Prop
Scalping
SMC
Stocks
AI
XAUUSD
NAS100
USDJPY
Los productos disponibles a través de cTrader Store, incluidos bots, indicadores y plugins para operar, son proporcionados por desarrolladores de terceros y están disponibles únicamente con fines informativos y de acceso técnico. cTrader Store no es un bróker, por lo que no proporciona asesoramiento de inversión, recomendaciones personales ni ninguna garantía de rentabilidad futura.
Más de este autor


Precio
Desde 24/04/2025
168.09M
Volumen operado
17.73K
Pips ganados
11
Ventas
328
Instalaciones gratis