
説明
✅ 正規化されたモメンタムで買われ過ぎ&売られ過ぎの状態を識別
✅ 安定したシグナル生成のために平滑化されたEMAベースの中心価格を使用
✅ モメンタム圧力を視覚化するために二重ヒストグラム(Oo & Ll)を表示
✅ カラーコード化されたバーで即座に強気、弱気、または迷いのフェーズを表示
✅ 厳密なクロスオーバー矢印で正確な買い&売りポイントをマーク
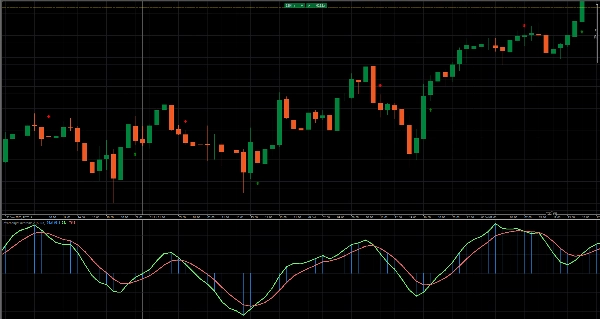
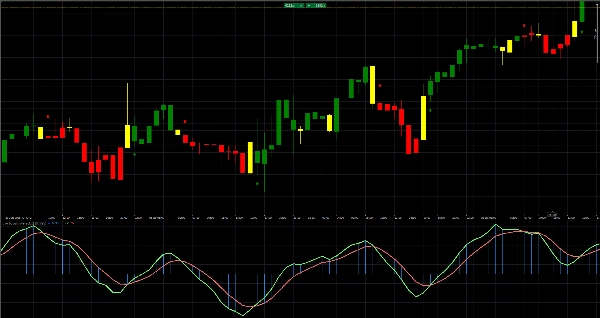
タイミングを向上させるために買われ過ぎ/売られ過ぎインジケーター:EMAを使って平滑化された中心価格(ys1)を計算し、標準偏差でモメンタムを正規化し、二重ヒストグラム(Oo & Ll)と上下のEMAラインをプロットします。カラーコード化されたバーは強気(緑)、弱気(赤)、または迷い(黄色)のモメンタム変化を即座に強調表示し、厳密なクロスオーバー矢印が正確な買いと売りのポイントを示します。このオーバーレイをチャートに追加して、明確な買われ過ぎ/売られ過ぎのシグナルを得て、自信を持ってエントリーとエグジットのタイミングを計りましょう!
CBOTとしても利用可能買われ過ぎ売られ過ぎ cbot cBot - cTrader Store
概要
AIによる概要
The Overbought / Oversold Indicator is a technical analysis tool designed to identify overbought and oversold market conditions using normalized momentum. It calculates a smoothed central price via an exponential moving average (EMA) and normalizes momentum through standard deviation. The indicator displays dual histograms (Oo and Ll) alongside up/down EMA lines to visualize momentum pressure. Color-coded bars indicate bullish (green), bearish (red), or indecisive (yellow) momentum phases, providing clear visual cues. Additionally, strict crossover arrows mark precise buy and sell points to assist in timing entries and exits. This overlay can be applied to various markets including forex, commodities, indices, stocks, and cryptocurrencies, supporting symbols such as GBPUSD, EURUSD, USDJPY, XAUUSD, BTCUSD, and NAS100. The indicator integrates concepts related to RSI, MACD, Bollinger Bands, Fibonacci levels, and other momentum and trend tools. It is suitable for traders employing strategies like scalping, breakout, martingale, grid, and smart money concepts. The indicator is also available as a cBot for automated trading on the cTrader platform.
インジケーターのプロフィール
カスタマーレビュー
5.0
レビュー: 2
5 | 100 % | |
4 | 0 % | |
3 | 0 % | |
2 | 0 % | |
1 | 0 % |
カスタマーレビュー
July 25, 2025
It helped mostly by making bad ideas easier to skip, and It needs a boring test before bigger size.
July 13, 2025
ディスカッション
よくあるご質問
Signal
Indices
Commodities
GBPUSD
RSI
Bollinger
Fibonacci
Scalping
AI
XAUUSD
NAS100
MACD
BTCUSD
Forex
Breakout
EURUSD
NZDUSD
Martingale
Prop
ZigZag
Supertrend
Fair Value Gap
SMC
Crypto
Grid
Stocks
ATR
USDJPY
VWAP
cTrader Storeで入手可能な取引ボット、インジケーター、プラグインなどの商品は、第三者の開発者が提供するものであり、情報と技術の取得のみを目的としてご利用いただけます。cTrader Storeはブローカーではなく、投資助言や個人的な推奨を行うことも、将来のパフォーマンスを保証することもありません。
この作成者の他の商品


価格
59
販売
922
無料インストール