
Atlas Seasonal Returns Heatmap
지표
3 구매
버전 1.0, Sep 2025
Windows, Mac
4.5
리뷰: 2
설명
🧭 거래 타이밍을 시계로 맞추세요: Atlas는 시장이 월별, 요일별, 시간별로 움직이는 경향이 있는 시기를 보여줍니다. 🧭
당신의 시장이 움직이는 경향이 있는 시기를 확인하세요 — 월별, 요일별 또는 시간별로.
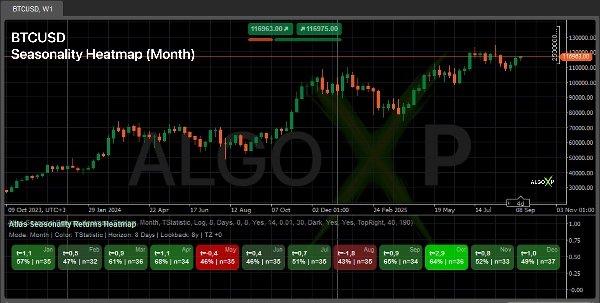
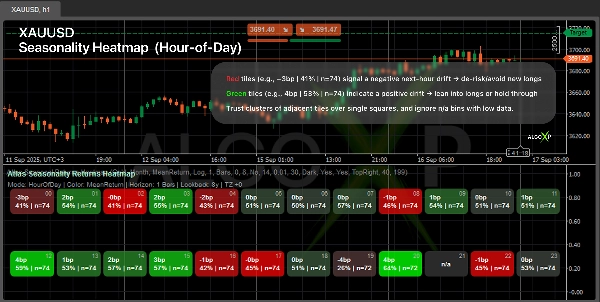
Atlas는 선행 수익률을 선택한 기간 동안 계산하고 대칭 히트맵(하락 → 0 → 상승)을 그립니다. 각 타일은 지표(평균, T-통계량, 또는 샤프 지수)와 함께 적중률% | n을 보여줍니다. 이를 사용하여 진입/청산 타이밍, 세션 계획, 그리고 위험 필터링을 하세요.
🎯 트레이더들이 사용하는 이유
- 기울이기 좋은 녹색 창과 물러서야 할 빨간 창을 식별합니다.
- 통계적으로 유리한 시간/요일에 맞춰 세션을 계획합니다.
- 재량적 및 체계적 전략에 깔끔한 “언제” 레이어를 추가합니다.
⚙️ 작동 방식
- 선택한 기간 동안 앞을 내다보고 가격이 어떻게 움직이는지 요약합니다.
- 결과를 시간 구간(월 / 요일 / 시간)으로 그룹화하고 사용자의 시간대를 반영합니다.
- 각 구간별로 이상치 보호와 견고한 강도 점수(샘플 크기 포함)를 적용합니다.
- 중립을 중심으로 균형 잡힌 히트맵을 당신의 상승 / 0 / 하락 색상으로 그립니다.
👥 대상 사용자
- 재량 트레이더 — 세션별로 더 나은 타이밍과 규모 조절.
- 시스템 및 봇 개발자 — 전략을 위한 시간 필터 / 시간 규모 조절 레이어.
- 암호화폐 및 지수 트레이더 — 일별/시간별 빠른 행동 패턴.
- 초보자 — 간단한 해석: 더 녹색일수록 선택한 기간 동안 긍정적 편향이 더 큼.
🚀 빠른 시작
- 자산 프리셋(Forex/Crypto/Index/Gold)을 선택하세요.
- 기간(예: HOD는 1시간, DOW/월은 1일)을 설정하세요.
- 조회 기간, 최소 관측치, 색상을 조정하세요.
- 가장 강력한 신호를 위해 여러 인접한 녹색/빨간 타일 클러스터를 읽으세요.
ℹ️ 계절성은 미래 결과를 보장하지 않습니다. 이는 기간과 방법론에 따라 달라지는 통계적 패턴입니다. 진입/청산 규칙과 위험 관리를 위한 맥락으로 지표를 사용하고, 여러 조회 기간에 걸쳐 견고성을 테스트하며, 샘플 크기(n)가 작은 구간에 의존하지 마세요.
요약
AI 요약
Atlas Seasonal Returns Heatmap is an indicator designed to reveal when markets tend to move by analyzing forward returns over user-defined horizons. It displays a symmetric heatmap organized by time buckets—Month, Day-of-Week, and Hour-of-Day—using color-coded tiles that represent metrics such as Mean, T-stat, Sharpe ratio, along with hit percentage and sample size. This visualization helps traders identify statistically favorable periods to time entries and exits, plan trading sessions, and manage risk.
The indicator supports multiple asset presets including Forex, Crypto, Indices, and Commodities, and respects the user’s timezone. It applies outlier protection and calculates a robust strength score per time bucket to ensure reliable insights. Users can customize parameters like lookback period, minimum observations, and color schemes.
Atlas is suitable for discretionary traders seeking better timing and sizing, system and bot builders needing a time-based filter or sizing layer, crypto and index traders analyzing behavioral patterns, and beginners looking for a straightforward indication of positive or negative market bias. It provides a statistical context for entry/exit decisions and risk management but should be used alongside other analysis tools.
지표 프로필
고객 리뷰
4.5
리뷰: 2
5 | 50 % | |
4 | 50 % | |
3 | 0 % | |
2 | 0 % | |
1 | 0 % |
고객 리뷰
October 1, 2025
One green trade proves nothing. It keeps weak ideas from looking too clean.
September 21, 2025
Two sessions say more than one clean chart. The checklist feels less annoying.
상담
자주 묻는 질문(FAQ)
BTCUSD
Forex
Indices
EURUSD
Commodities
GBPUSD
NZDUSD
Prop
Crypto
Stocks
XAUUSD
NAS100
USDJPY
트레이딩 봇, 지표, 플러그인 등 cTrader Store에서 제공되는 상품은 제3자 개발자에 의해 제공되며, 이는 단순히 정보 및 기술적 접근을 목적으로 제공된 것입니다. cTrader Store는 중개인이 아니며, 투자 조언, 개인별 추천 또는 향후 성과에 대한 어떠한 보장도 제공하지 않습니다.


가격
가입일 13/08/2025
437
판매
4.57K
무료 설치