

설명
정확하게 높은 확률의 추세를 발견하세요. Multi-Symbol Trendlines 지표는 일련의 고점 상승 / 저점 상승 / 고가 마감 또는 저점 하락 / 고점 하락 / 저가 마감을 감지하여, 모든 시장 심볼에서 상승 추세와 하락 추세에 대한 명확하고 맞춤형 인사이트를 제공합니다.
🚀 주요 기능
- 추세 연속성 감지: 연속된 가격 구조 패턴을 기반으로 강세 또는 약세 연속을 포착합니다.
- 맞춤형 임계값: 유효한 추세를 확인하는 데 필요한 바 수를 설정하여 전략에 맞게 조정하세요.
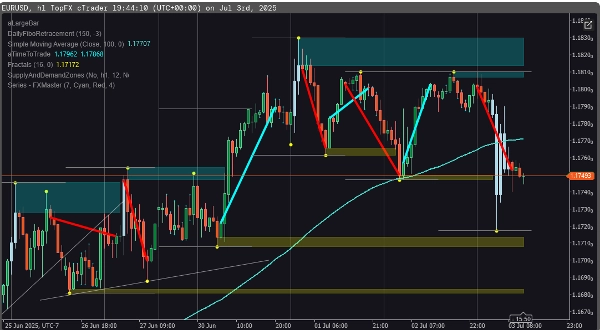
- 시각적 추세선: 차트에 자동으로 추세선을 그리며, 상승 추세와 하락 추세에 따라 색상으로 구분됩니다.
🎯 대상 사용자
- 가격 행동 트레이더: 지표보다 구조와 리듬에 의존하는 트레이더.
- 추세 추종자: 초기 구조 확인을 찾는 트레이더.
- 다중 심볼 감시자: 모든 것을 아우르는 하나의 도구가 필요한 사용자.
요약
AI 요약
The Series - FXMaster indicator identifies high-probability trends by detecting sequences of price action patterns such as Higher Highs, Higher Lows, High Closes, Lower Lows, Lower Highs, and Low Closes. It provides clear, customizable insights into uptrends and downtrends across any market symbol, including Forex, indices, commodities, cryptocurrencies, and stocks. Key features include trend sequence detection to spot bullish or bearish patterns based on consecutive price structures, customizable thresholds allowing users to set the number of bars required to confirm a trend, and automatic drawing of color-coded trendlines directly on charts for visual clarity. This tool is designed for price action traders who prioritize market structure and rhythm, trend followers seeking early confirmation of trends, and multi-symbol watchers who require a unified indicator for multiple markets.
지표 프로필
고객 리뷰
4.6
리뷰: 3
5 | 67 % | |
4 | 33 % | |
3 | 0 % | |
2 | 0 % | |
1 | 0 % |
고객 리뷰
July 14, 2025
The opening read should not drive the whole decision, but it is just a support layer.
July 8, 2025
The journal has a cleaner path, but it works better with a written plan.
상담
자주 묻는 질문(FAQ)
Forex
Indices
Commodities
Crypto
Stocks
트레이딩 봇, 지표, 플러그인 등 cTrader Store에서 제공되는 상품은 제3자 개발자에 의해 제공되며, 이는 단순히 정보 및 기술적 접근을 목적으로 제공된 것입니다. cTrader Store는 중개인이 아니며, 투자 조언, 개인별 추천 또는 향후 성과에 대한 어떠한 보장도 제공하지 않습니다.
이 작성자의 상품 더 보기


가격
가입일 11/01/2025
19
판매