
Market Structure SNR + Auto Bias
지표
7 구매
버전 2.1, Nov 2025
Windows, Mac
4.3
리뷰: 3
설명
Heikin Ashi 구조 편향 (cTrader 지표)
자동 공급-수요 구역과 다중 타임프레임 편향.
무엇을 하는가 – 쉬운 설명
이 지표는 자동으로:
- Heikin Ashi 가격 움직임을 읽고 의미 있는 피벗 변화를 감지합니다.
- 그 피벗 주변에 동적인 지지 및 저항 구역을 구축하며 심지어 심지(윅) 극단과 캔들 몸통을 사용합니다 (단순한 임의의 선이 아닙니다).
- 근처 구역을 지능적으로 병합하여 수평선 숲 대신 깔끔하고 거래 가능한 수준을 보여줍니다.
- 가격이 최신 지지 또는 저항 구역을 완전히 돌파할 때마다 명확한 상승 또는 하락 편향을 생성합니다.
- 다음에 대한 편향을 보여줍니다:
-
- 당신의 차트 타임프레임, 그리고
- 선택적 상위 타임프레임 (기본값 H2) — 차트에 HTF 혼란을 그리지 않고.
결과: 한눈에 진짜 수준이 어디인지 그리고 시장이 현재 상승세인지 하락세인지 알 수 있습니다.
해결하는 문제
대부분의 트레이더가 겪는 같은 문제들:
- 수동으로 그린 지지/저항선은:
-
- 주관적이고,
- 일관성이 없으며,
- 종종 과도하게 그려집니다.
- 단순한 “지그재그 + 수평선” 지표들은:
-
- 구역 너비를 제대로 처리하지 못하고,
- 수준이 겹쳐 쌓이며,
- 구역이 너무 길어져 차트의 절반을 덮기도 합니다.
- 편향은 종종 “머릿속에만” 있어 명확히 보거나 규칙 기반으로 사용하기 어렵습니다.
이 지표는 다음을 위해 만들어졌습니다:
- Heikin Ashi 구조를 명확하고 객관적인 구역으로 전환하고,
- 그 구역을 기반으로 한 규칙 기반 추세/편향을 제공하며,
- 차트를 깔끔하고 읽기 쉽게 유지합니다.
구역이 구축되는 방법 (트레이더 친화적 설명)
각 Heikin Ashi 피벗에 대해, 지표는 3캔들 구조를 봅니다:
- HA가 빨간색에서 녹색으로 전환될 때, 지지 피벗을 표시합니다.
- HA가 녹색에서 빨간색으로 전환될 때, 저항 피벗을 표시합니다.
그 다음 구역을 구축합니다:
지지 구역
- 3개의 캔들 중에서 가장 낮은 심지를 찾습니다 (진짜 극단점).
- 그 극단점보다 여전히 높은 다음으로 낮은 저점을 찾습니다.
- 그 내부 저점 근처의 캔들 몸통(시가/종가)을 사용해 구역의 “거래 가능한” 쪽을 정의합니다.
- 최종 지지 구역:
-
- 하단 = 극단적인 심지 저점,
- 상단 = 몸통 기반 내부 수준.
저항 구역
- 3개의 캔들 중에서 가장 높은 심지를 찾습니다.
- 그 극단점보다 여전히 낮은 다음으로 높은 고점을 찾습니다.
- 그 내부 고점 근처의 몸통을 사용합니다.
- 최종 저항 구역:
-
- 상단 = 극단적인 심지 고점,
- 하단 = 몸통 기반 내부 수준.
따라서 각 구역은 단순한 임의의 밴드가 아니라:
가격이 실제로 반전하거나 거부한 심지-몸통 범위입니다.
병합 논리 (차트가 깔끔한 이유)
같은 유형의 구역들 (지지와 지지, 저항과 저항):
- 타임라인 상의 단위로 처리됩니다.
- 실제로 가격이 겹칠 때만 병합할 수 있습니다.
- 병합은 엄격히 지역적입니다:
-
- 새 구역은 다음과 병합할 수 있습니다:
-
- 가장 최근 구역(연속), 또는
- 두 번째로 최근 구역(+1 간격), 그리고
- 새 결합 구역이 이전 구조와 겹칠 경우 추가 “앵커” 병합 하나.
이것은 동작을 직관적으로 유지합니다:
- 구역이 전체 이력을 “삼키지” 않습니다.
- 오래된 수준은 존중되지만 거대한 메가 구역 생성을 허용하지 않습니다.
- A–B–C 또는 A–C+D 같은 지역 구조는 통제된 방식으로 처리됩니다.
편향 논리 (실제로 어떻게 거래하는가)
각 타임프레임(메인 및 HTF)에 대해:
- 지표는 최신 병합된 지지 구역과 최신 병합된 저항 구역을 추적합니다.
- 그런 다음 각 마감된 캔들에서:
-
- 가격이 최신 저항 구역 위에서 마감하면 → 편향이 강세가 됩니다.
- 가격이 최신 지지 구역 아래에서 마감하면 → 편향이 약세가 됩니다.
다음 정보를 저장합니다:
- 마지막 편향 전환의 시간,
- 가격이 구역을 돌파한 가격 수준.
차트에는 작은 텍스트 패널이 표시됩니다:
메인 (H1) 편향: 강세메인 (H1) 전환: 11/26 15:00 @1.08750
HTF가 활성화되면 다음과 같은 내용도 볼 수 있습니다:
HTF (H2) 편향: 약세HTF (H2) 전환: 11/25 08:00 @1.09200
메인 타임프레임 편향이 전환될 때 사운드 알림도 활성화할 수 있습니다.
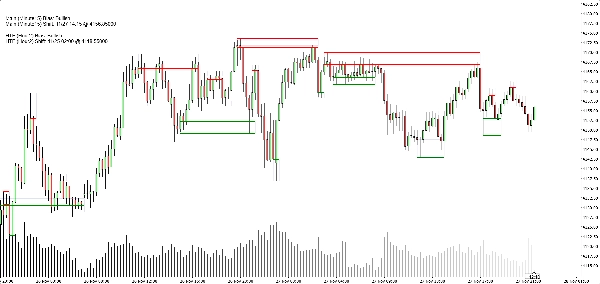
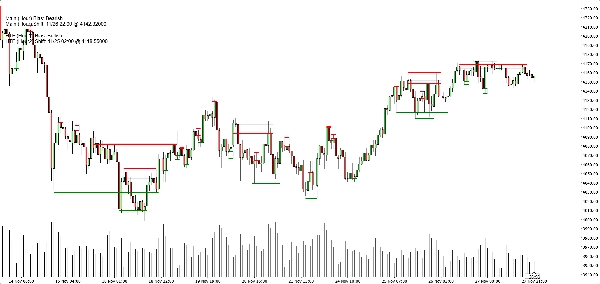
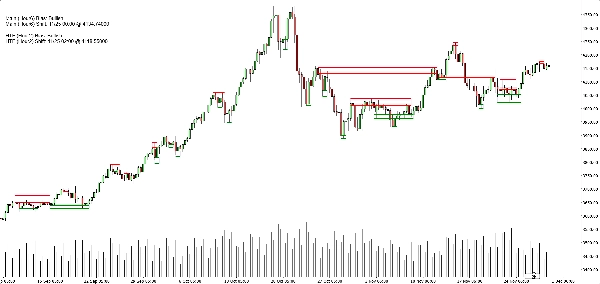
차트에서 볼 수 있는 것
- 지지 구역:
-
- 녹색 수평 기본/트리거 라인 (선택 사항),
- 전체 지지 밴드를 보여주는 부드러운 네이비 사각형 (매우 낮은 불투명도).
- 저항 구역:
-
- 빨간 선 + 밴드를 위한 부드러운 네이비 사각형.
- 깔끔한 표시 토글:
-
- 지지 구역 표시/숨기기,
- 저항 구역 표시/숨기기,
- 채워진 사각형 켜기/끄기,
- 기본/트리거 라인 켜기/끄기,
- 편향 패널 켜기/끄기.
이것은 다양한 트레이더가 다음 중 선택할 수 있게 합니다:
- 더 미니멀한 모습 (아마도 사각형만), 또는
- 더 정확한 보기 (정확한 선 표시).
일반적인 사용 사례
다음 용도로 유용하게 사용할 수 있습니다:
- 추세 필터링
-
- 메인 TF와 HTF 편향이 모두 강세일 때만 매수 기회를 찾습니다.
- 둘 다 약세일 때만 매도 기회를 찾습니다.
- 구역 진입
-
- 구역을 관심 영역으로 사용합니다:
-
- 지정가 주문,
- 확인 진입 (예: 가격이 깨진 구역으로 돌아와 다시 거부),
- 외부 밴드 바로 너머에 스톱 배치.
- 톱다운 분석
-
- HTF 편향 (기본값 H2)으로 큰 그림을 보고,
- 차트 TF 편향으로 타이밍을 잡으며,
- 구역을 구체적인 실행 수준으로 사용합니다.
아닌 것 (정직한 판매를 위해 중요)
- 이것은 자동 거래 로봇이 아닙니다.
- 이것은 수익을 보장하는 “성배” 신호가 아닙니다.
- 이것은 구조 및 편향 엔진입니다:
-
- 객관적으로 구역을 정의하고,
- 그 구역을 기반으로 객관적으로 추세/편향을 정의하며,
- 실제 거래 관리는 트레이더/전략에 맡깁니다.
요약
AI 요약
Market Structure SNR + Auto Bias is a trading indicator designed to identify and visualize key market structure elements using Heikin Ashi price action. It automatically detects meaningful pivot points where price momentum shifts, then constructs dynamic support and resistance zones based on the wick extremes and candle bodies of these pivots. The indicator intelligently merges overlapping zones to present clear, tradable levels without cluttering the chart.
It provides a rule-based bullish or bearish bias by tracking price breaks above resistance or below support zones on both the current chart timeframe and an optional higher timeframe. This bias is displayed on a built-in dashboard panel, with optional sound alerts for bias changes.
The indicator works across all timeframes and markets where price forms swings, including forex, crypto, stocks, and futures. It features customizable lookback periods, automatic cleanup of old zones, and toggles for display elements to suit different trader preferences.
Typical uses include trend filtering by aligning biases across timeframes, identifying zone entries for limit or confirmation orders, and supporting top-down analysis. The tool timestamps and sequences pivots and bias shifts, facilitating automation or journaling. It is a structure and bias engine that aids traders in objectively defining market levels and trends while maintaining chart clarity.
지표 프로필
고객 리뷰
4.3
리뷰: 3
5 | 33 % | |
4 | 67 % | |
3 | 0 % | |
2 | 0 % | |
1 | 0 % |
고객 리뷰
May 25, 2025
Clean market assistant if the trader wants it makes market context easier to scan. It works best as support, not a final decision maker. I would test it on 2 timeframes, 20 signals and a 1R stop plan. it should not be used as a blind entry trigger.
May 24, 2025
May 24, 2025
Useful pick for demo for traders who combine signals before acting. It gives value around chart reading, but it should not be used as a blind entry trigger. The cleaner reads should hold across 3 sessions, not just 1 good chart. It is stronger when a 1.5R target is realistic before the entry.
상담
자주 묻는 질문(FAQ)
Forex
Scalping
Crypto
Stocks
트레이딩 봇, 지표, 플러그인 등 cTrader Store에서 제공되는 상품은 제3자 개발자에 의해 제공되며, 이는 단순히 정보 및 기술적 접근을 목적으로 제공된 것입니다. cTrader Store는 중개인이 아니며, 투자 조언, 개인별 추천 또는 향후 성과에 대한 어떠한 보장도 제공하지 않습니다.
이 작성자의 상품 더 보기


가격
가입일 25/03/2025
180.96M
거래량
2.17M
핍 수익
21
판매