
설명
Half Trend 지표는 지정된 기간 동안 최근 고점과 저점을 비교하여 잠재적인 추세 반전을 감지하고 강조 표시하도록 설계되었으며, 이에 따라 “상승” 또는 “하락” 선을 그립니다. 선택적으로 각 추세 변화 시 화살표를 그릴 수 있으며 신호 간의 핍 차이를 표시할 수 있습니다.
- 고점/저점 시리즈 선택
- 이 지표는 두 개의 가격 시리즈(기본값은 고가와 저가)를 사용하여 지역 최대값과 최소값을 추적합니다.
- 각 시리즈에 대해
시가,종가,중간값등 다양한 가격 유형을 최대 가격 및 최소 가격을 통해 선택할 수 있습니다.
- 이동 평균 및 기간 계산
- 선택한 스무딩 유형과 진폭 기간에 기반한 이동 평균이 선택된 “고가”와 “저가” 가격 시리즈 모두에 적용됩니다.
- 지표는 현재 바의 가격을 이 스무딩된 고가/저가 수준과 비교하여 상승 추세에서 하락 추세로(또는 그 반대로) 전환할지 결정합니다.
- 추세 감지 및 플로팅
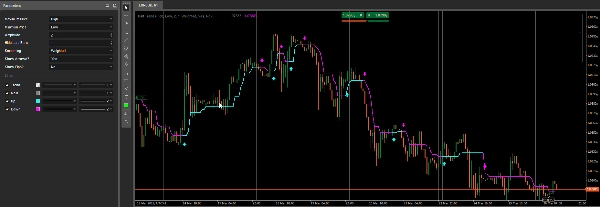
- 지표가 상승 추세를 식별하면 상승 선(청록색)을 그리고
Trend값을+1로 설정합니다. - 하락 추세를 감지하면 하락 선(마젠타색)을 그리고
Trend값을-1로 설정합니다. - 내부적으로 현재 지지/저항 수준을 반영하도록 메인 출력(회색)이 업데이트됩니다.
Trend는 추세 방향을 숫자로 저장하는 보이지 않는 출력 시리즈입니다(+1또는-1).
- 지표가 상승 추세를 식별하면 상승 선(청록색)을 그리고
- 화살표 및 핍 계산
- 화살표 표시? – 활성화하면 지표가 추세 반전이 감지된 각 새 바에 화살표를 그립니다.
- 핍 표시? – 활성화하면 마지막 신호와 새 신호 간의 핍 차이를 계산하여 차트에 작은 라벨과 추세선을 그려 표시합니다.
요약
AI 요약
The Half Trend BT indicator detects potential trend reversals by analyzing recent highs and lows over a specified period. It compares two selected price series—typically High and Low, but configurable to other price types such as Open, Close, or Median—using moving averages based on chosen smoothing methods and amplitude periods. The indicator plots an "Up" line (cyan) when an uptrend is detected and a "Down" line (magenta) for a downtrend, while internally storing trend direction numerically (+1 or -1). A main output line (gray) reflects current support and resistance levels. Optional features include drawing arrows on bars where trend reversals occur and calculating pip differences between signals, which are displayed as labels and trendlines on the chart. This indicator supports multiple markets including Forex, indices, commodities, cryptocurrencies, and stocks.
지표 프로필
고객 리뷰
4.3
리뷰: 3
5 | 33 % | |
4 | 67 % | |
3 | 0 % | |
2 | 0 % | |
1 | 0 % |
고객 리뷰
March 29, 2025
Clean idea for traders around chart reading. The useful part is adding confirmation before a trade, with the numbers checked before scaling. The cleaner reads should hold across 3 sessions, not just 1 good chart. It is stronger when a 1.5R target is realistic before the entry.
March 28, 2025
March 28, 2025
Decent tool for testing if the trader wants it makes market context easier to scan. It works best as support, not a final decision maker. I would test it on 2 timeframes, 20 signals and a 1R stop plan. it should not be used as a blind entry trigger.
상담
자주 묻는 질문(FAQ)
Prop
Forex
Signal
Indices
Commodities
Crypto
Stocks
트레이딩 봇, 지표, 플러그인 등 cTrader Store에서 제공되는 상품은 제3자 개발자에 의해 제공되며, 이는 단순히 정보 및 기술적 접근을 목적으로 제공된 것입니다. cTrader Store는 중개인이 아니며, 투자 조언, 개인별 추천 또는 향후 성과에 대한 어떠한 보장도 제공하지 않습니다.


!["[Hamster-Coder] Pivot Points MTF" 로고](https://cdn.ctrader.com/image/webp/4c143e5a-309c-40e3-a578-f04d1e133ffa_31159)


가격
48
판매
1.04K
무료 설치