
설명
가격 변동 번들 — 3개의 지표, 1개의 논리.
제 개인 설정에서 가져온 도구들(Supply & Demand + 맞춤형 ZigZag). 높은 TF 마감 주변에서 가격이 실제로 어떻게 움직이는지 보여주기 위해 만들어졌습니다.
모듈을 켜거나 끄기 — 레벨, 바, 히스토그램을 개별적으로 활성화/비활성화할 수 있습니다.
모듈
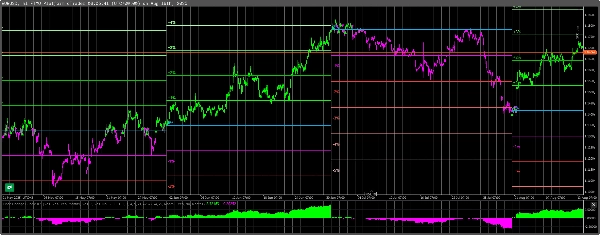
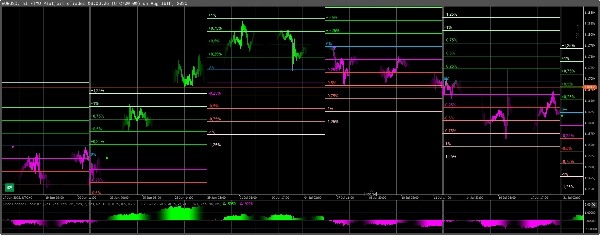
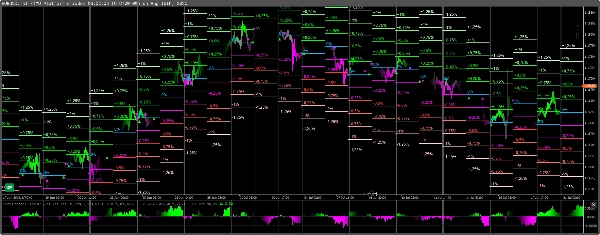
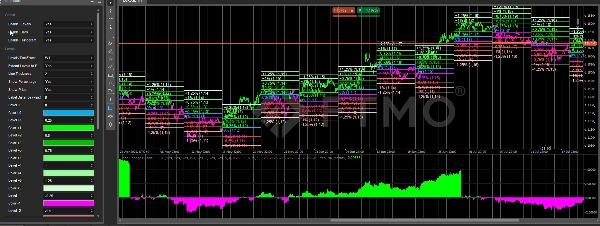
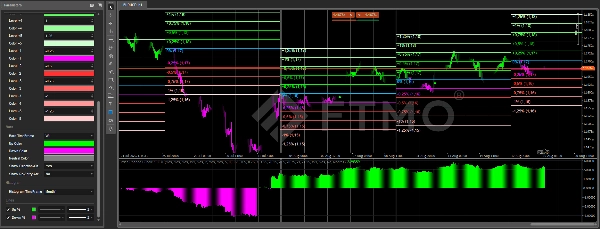
가격 변동 레벨
- 선택한 시간 프레임에서 퍼센트 구역(±0.25…±1.25%)을 그립니다.
- 각 구역은 0% 기준선에서 측정되며 퍼센트와 가격를 표시합니다.
- 주간/월간 지도를 깔끔하게 하기 위해 선을 기간 끝까지 연장할 수 있는 옵션이 있습니다.
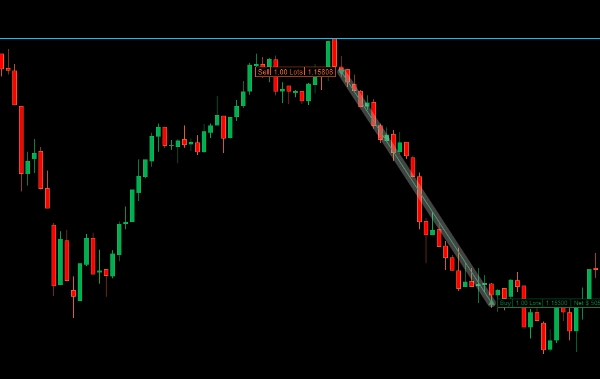
가격 변동 바
- TF 피벗에 대해 완전 상향/하향 모드로 캔들을 색칠합니다.
- 진입 및 모드 빠른 확인을 위해 바 마감 시 사용하기에 가장 좋습니다.
- 중립 → 같은 쪽 이후의 방향 전환 및 재진입 화살표를 포함합니다.
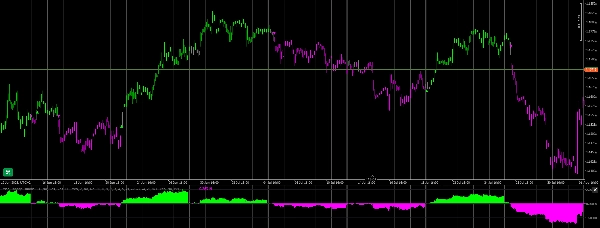
가격 변동 히스토그램
- 동일 TF 기준(상승% / 하락%) 대비 전체 퍼센트 변동을 보여줍니다.
- 한눈에 가속/감속을 파악하기에 좋습니다.
작동 원리 — “가격 움직임의 비밀”
- 전문가들은 높은 TF(MN/W1/D1)의 이전 마감가에 기준을 둡니다.
- 그 기준에서 측정된 퍼센트 거리는 실용적인 자석/목표처럼 작용합니다.
- 캔들이 피벗 위/아래에 완전히 위치하면 모드가 정의되고; 중립 이후의 재진입은 종종 움직임을 계속합니다.
유연한 사용
- 모듈별로 원하는 시간 프레임 선택 가능 (예: MN 레벨 • W1 바 • D1 히스토그램).
- 모든 차트 유형에서 작동, 포함하여 Renko/범위/틱 (계산은 선택한 시간 기반 TF를 사용합니다).
- 재도색 없음. 가벼움.
비디오 & 지원
- 설치, 프리셋, 거래 예제를 포함한 단계별 비디오가 곧 게시될 예정입니다.
- 구매자는 질문, 설정 도움 또는 피드백을 위해 저에게 직접 연락할 수 있습니다. 개인적으로 답변드립니다.
요약
AI 요약
Price Change Bundle 1.0 BT is a composite indicator consisting of three modules—Levels, Bars, and Histogram—designed to analyze price movements relative to higher timeframe closes. It integrates concepts from Supply & Demand and a custom ZigZag to reveal how price behaves around significant reference points.
- Price Change Levels: Displays percentage zones (±0.25% to ±1.25%) from a 0% baseline within a selected timeframe, showing both percentage and price values. Lines can be extended to the period’s end for clear weekly or monthly mapping.
- Price Change Bars: Colors candles based on their position relative to the timeframe pivot, indicating regimes with full above/below coloring. Includes arrows signaling direction changes and re-entries after neutral phases, aiding entry decisions.
- Price Change Histogram: Illustrates overall percentage development (Up%/Down%) against the same timeframe reference, facilitating quick identification of acceleration or slowdowns.
Each module can be toggled on or off independently and configured with different timeframes. The indicator works on any chart type, including Renko, range, and tick charts, using time-based timeframe calculations. It anchors calculations to previous closes of higher timeframes (monthly, weekly, daily) and does not repaint. Buyers have access to direct support from the developer.
지표 프로필
고객 리뷰
4.0
리뷰: 1
5 | 0 % | |
4 | 100 % | |
3 | 0 % | |
2 | 0 % | |
1 | 0 % |
고객 리뷰
February 9, 2026
Price Change Bundle 1.0 BT delivers clear and practical price-change metrics. Best used on M10-H1, where momentum readings stay balanced and meaningful. Great for filtering weak moves, confirming impulse strength and improving intraday timing. A simple but effective companion for momentum-based strategies.
상담
자주 묻는 질문(FAQ)
Prop
Forex
Signal
Breakout
Indices
트레이딩 봇, 지표, 플러그인 등 cTrader Store에서 제공되는 상품은 제3자 개발자에 의해 제공되며, 이는 단순히 정보 및 기술적 접근을 목적으로 제공된 것입니다. cTrader Store는 중개인이 아니며, 투자 조언, 개인별 추천 또는 향후 성과에 대한 어떠한 보장도 제공하지 않습니다.


!["[Hamster-Coder] Pivot Points MTF" 로고](https://cdn.ctrader.com/image/webp/4c143e5a-309c-40e3-a578-f04d1e133ffa_31159)

!["[Stellar Strategies] Smart ADX" 로고](https://cdn.ctrader.com/image/webp/af13b084-b6f6-41db-b7bc-c7e688b57b05_36929)


가격
48
판매
1.07K
무료 설치