
DMI 3 bar v2
Chỉ báo
2 lượt mua
Phiên bản 1.0, Dec 2024
Windows, Mac
5.0
Đánh giá: 1
Mô tả
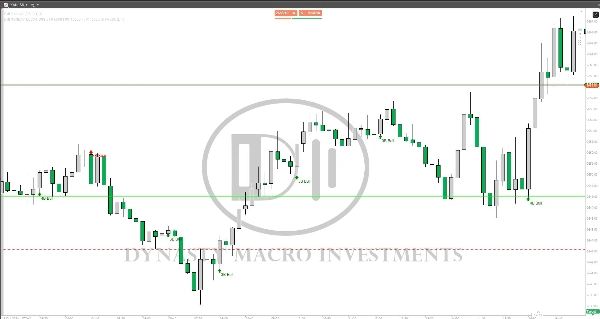
Hiển thị tín hiệu MUA & BÁN cho MẪU 3 & 4 THAN (Sao mai/ Sao hôm). Nó có thể điều chỉnh và sẽ HIỂN THỊ MŨI TÊN.
Tóm tắt
Tóm tắt AI
DMI 3 bar v2 is a technical indicator designed to identify BUY and SELL signals based on 3 and 4 bar candlestick patterns, specifically the Morning Star and Evening Star formations. The indicator is adjustable to user preferences and visually displays signals using arrows on the chart. It supports pattern recognition to assist traders in decision-making by highlighting potential reversal points indicated by these classic candlestick patterns.
Hồ sơ chỉ báo
Đánh giá của khách hàng
5.0
Đánh giá: 1
5 | 100 % | |
4 | 0 % | |
3 | 0 % | |
2 | 0 % | |
1 | 0 % |
Thảo luận
Câu hỏi thường gặp
Các sản phẩm có sẵn trên cTrader Store, bao gồm bot giao dịch, chỉ báo và plugin, được cung cấp bởi các nhà phát triển bên thứ ba và chỉ nhằm mục đích cung cấp thông tin và tiếp cận kỹ thuật. cTrader Store không phải là nhà môi giới và không cung cấp lời khuyên đầu tư, khuyến nghị cá nhân hay bất kỳ đảm bảo nào về hiệu suất trong tương lai.
Sản phẩm khác của tác giả này


Giá
2
Lượt bán