
설명
🌐 시장 구조 변화 – 전문 시장 구조 오실레이터
진정한 추세 방향 식별. 노이즈 필터링. 자신감 있는 거래.
시장 구조 변화는 모든 시장 상황에서 명확성, 정확성 및 신뢰성을 원하는 트레이더를 위해 설계된 차세대 구조적 추세 오실레이터입니다.
후행 이동평균이나 변동성 기반 도구에 의존하는 대신, 이 지표는 가격 행동의 핵심에 집중합니다: 스윙 고점과 스윙 저점.
그 결과는 즉시 다음을 식별하는 데 도움이 되는 깔끔하고 매우 반응성이 뛰어난 추세 모델입니다:
- 진정한 시장 편향
- 구조 전환
- 추세 지속 강도
- 숨겨진 모멘텀 변화
스윙 트레이드, 일중 거래 또는 알고리즘 시스템을 운영하든, Market Structure Shift는 전문 등급의 구조적 프레임워크를 차트에 직접 제공합니다.
🔥 왜 시장 구조가 중요한가
대부분의 지표는 가격이 이미 움직인 후를 분석합니다.
시장 구조는 다르게 작동합니다 — 추세 발전의 기초를 측정합니다:
- 더 높은 고점 / 더 높은 저점 → 강세 구조
- 더 낮은 고점 / 더 낮은 저점 → 약세 구조
이는 단순히 가격이 순간순간 무엇을 하는지뿐만 아니라 시장이 구축되고 있는 방향을 보여줍니다.
Market Structure Shift는 이 전체 과정을 자동화하여 읽기 쉬운 오실레이터로 변환합니다.
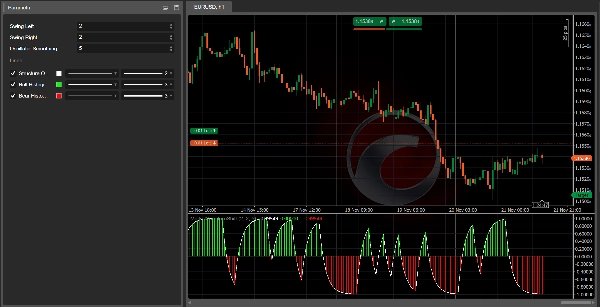
📊 지표가 보여주는 것
✔ 1. 구조 오실레이터 라인 (흰색)
우세한 구조를 명확히 표시하는 부드러운 EMA 기반 추세선:
- 0 이상 → 강세 구조
- 0 이하 → 약세 구조
- 0 근처 → 구조 불안정 또는 추세 전환
한눈에 시장이 실제로 어디에 있는지 알 수 있습니다.
✔ 2. 강세 히스토그램 (녹색)
강세 구조 내에서 강도와 모멘텀을 표시합니다.
막대가 강할수록 상승 압력이 강함을 의미합니다.
롱 포지션 설정 확인에 적합합니다.
✔ 3. 약세 히스토그램 (빨간색)
약세 구조의 모멘텀과 강도를 보여줍니다.
막대가 강할수록 하락 추세가 강함을 의미합니다.
숏 기회 검증에 이상적입니다.
🎯 트레이더들이 사용하는 방법 (전문 워크플로우)
A. 추세 확인 필터
구조적 모멘텀 방향으로만 거래하세요:
- 오실레이터가 0 이상일 때 롱 거래
- 오실레이터가 0 이하일 때 숏 거래
이 간단한 규칙만으로도 많은 잘못된 설정을 제거할 수 있습니다.
B. 구조적 반전 감지
오실레이터가 0선을 교차할 때 주요 전환이 보입니다:
- 빨강 → 초록 = 새로운 강세 구조
- 초록 → 빨강 = 새로운 약세 구조
이는 전통적인 도구가 반응하기 훨씬 전에 추세 변화를 조기에 파악할 수 있게 합니다.
C. 다중 타임프레임 최적화
이 지표는 MTF 워크플로우에서 특히 강력합니다:
- 추세 프레임워크에는 H4/H1 사용
- 진입에는 M30/M15 사용
역추세 거래를 방지하고 정확도를 극대화하세요.
D. 시장 구조 신호와의 시너지
Market Structure Shift는 Market Structure Signals와 결합할 때 완전한 거래 시스템이 됩니다. 이 신호는 다음을 제공합니다:
- 매수/매도 화살표
- 시각적 변화 표시기
- 구조적 돌파 경고
함께 사용하면 완전한 탑다운 구조 기반 방법론을 만듭니다.
⚙️ 모든 시장에 적합하게 설계됨
✔ 외환
✔ 지수
✔ 암호화폐
✔ 금속
✔ 합성 시장
✔ 선물 (CFD 대리인 통해)
다음 매개변수 제어로 인해 매우 적응력이 뛰어납니다:
- 스윙 감지
- 평활 강도
- 구조 변화에 대한 민감도
📈 권장 설정
- 스윙 좌/우: 외환 및 지수는 2–3, 암호화폐는 3–3
- 오실레이터 평활: 균형 잡힌 반응성을 위해 5–8
즉시 사용할 수 있도록 제작되었지만 완전히 사용자 정의 가능합니다.
💬 무료 도구 및 최적화를 위한 커뮤니티에 참여하세요
내 프로필의 링크를 클릭하여 거래 커뮤니티에 참여하면 다음을 찾을 수 있습니다:
- 최적화된 매개변수 세트
- 추가 도구
- 구조 기반 전략
- AlgoTrend 지표를 위한 독점 리소스
시스템을 성장시키고 일관성을 향상시키기에 좋은 공간입니다.
요약
Traders use Market Structure Shift for trend confirmation by trading only in the direction of structural momentum, detecting structural reversals via zero-line crossings, and optimizing multi-timeframe workflows (e.g., H4/H1 for trend framework, M30/M15 for entries). It integrates with Market Structure Signals to provide buy/sell arrows, visual shift markers, and structural break alerts, forming a comprehensive structure-based trading system.
The indicator supports multiple markets including Forex, indices, cryptocurrencies, metals, synthetic markets, and futures (via CFDs). It offers customizable parameters for swing detection, smoothing, and sensitivity to structural changes, enabling adaptability across different asset classes and trading styles.
고객 리뷰
5 | 0 % | |
4 | 100 % | |
3 | 0 % | |
2 | 0 % | |
1 | 0 % |


!["Gaussian Channel [Iridio Capital]" 로고](https://cdn.ctrader.com/image/webp/7c039209-5573-4a54-a072-f9528b503103_41960)


