
Description
Volume Bubbles – Indicateur personnalisé cTrader
Volume Bubbles est un indicateur visuel léger mais puissant pour cTrader qui met en évidence les chandeliers avec un volume exceptionnel directement sur le graphique des prix.
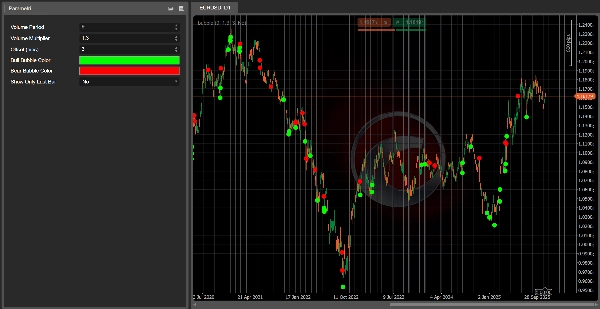
Au lieu de fixer l'histogramme de volume et d'essayer de deviner quelles barres comptent vraiment, cet outil détecte automatiquement lorsque le volume de la bougie actuelle est significativement supérieur à la moyenne récente et dessine une bulle (icône cercle) sur cette barre :
- Pour les chandeliers haussiers, une bulle est dessinée sous le plus bas de la bougie.
- Pour les chandeliers baissiers, une bulle est dessinée au-dessus du plus haut de la bougie.
Cela rend extrêmement facile de repérer des mouvements climactériques potentiels, des zones d'intérêt fort de la part de gros acteurs, ou des points possibles d'épuisement dans la tendance.
Caractéristiques principales
- ✅ Détecte les chandeliers à fort volume en utilisant une moyenne mobile du volume tick
- ✅ Dessine des bulles claires sur le graphique (pas besoin de sous-fenêtre supplémentaire)
- ✅ Couleurs différentes pour les pics de volume haussiers et baissiers
- ✅ Décalage ajustable en pips pour positionner les bulles à distance de la bougie
- ✅ Option pour afficher les bulles uniquement sur la dernière barre (pour le trading en temps réel)
Entrées / Paramètres
- Période de volume – Nombre de barres utilisées pour la moyenne mobile du volume.
- Multiplicateur de volume – Combien de fois au-dessus du volume moyen une barre doit être pour déclencher une bulle.
- Décalage (pips) – Distance entre la bulle et le plus haut/bas de la bougie.
- Couleur de la bulle haussière – Couleur des bulles sur les chandeliers haussiers.
- Couleur de la bulle baissière – Couleur des bulles sur les chandeliers baissiers.
- Afficher uniquement la dernière barre – Si vrai, affiche les bulles uniquement sur la barre en cours en direct.
Comment utiliser
Ajoutez Volume Bubbles à votre graphique et utilisez-le comme filtre visuel pour :
- Confirmer les cassures soutenues par un volume fort
- Repérer des renversements possibles ou des chandeliers d'épuisement
- Identifier les zones où les gros acteurs peuvent être actifs
Ce n'est pas un système de trading autonome, mais c'est un excellent outil compagnon pour toute stratégie basée sur l'action des prix ou le suivi de tendance qui prend en compte le volume.
👉 Rejoignez ici : Algotrendit Volume Bubbles
Dans le serveur, vous trouverez :
- Support pour cet indicateur et d'autres cBots/indicateurs
- Discussions sur les stratégies et idées d'optimisation
- Mises à jour, actualités et futurs outils que je publie
Résumé
Key features include adjustable parameters such as the volume period for averaging, volume multiplier threshold, bubble offset in pips, and customizable colors for bullish and bearish volume spikes. Users can also choose to display bubbles only on the latest bar for real-time trading. The indicator integrates directly on the price chart without requiring additional subwindows.
Volume Bubbles serves as a visual filter to confirm breakouts supported by strong volume, spot possible reversals or exhaustion candles, and identify zones of significant market activity. It complements price action and trend-following strategies by providing volume-based insights across various markets including forex, indices, commodities, stocks, and cryptocurrencies.
Avis clients
5 | 0 % | |
4 | 100 % | |
3 | 0 % | |
2 | 0 % | |
1 | 0 % |


