

Description
# 🚀 Indice de Glissement Cinétique (KSI) – Outil Avancé d'Analyse de la Pression du Marché & de la Liquidité
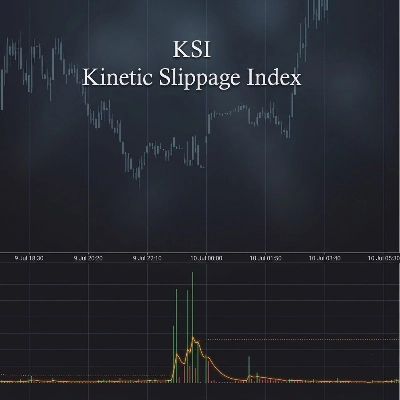
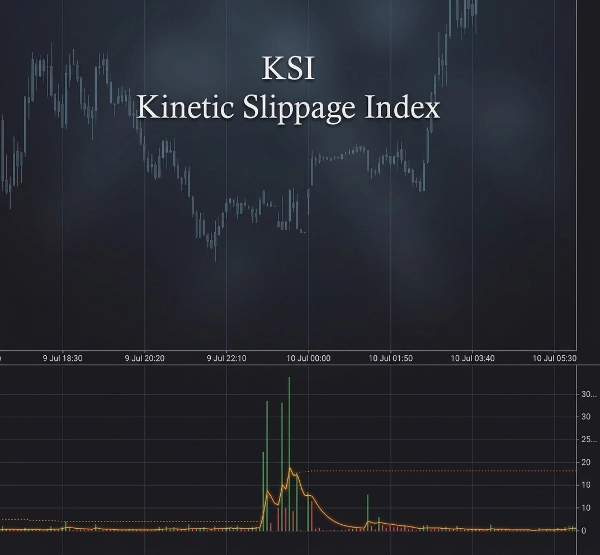
Découvrez des insights plus profonds du marché avec le **Kinetic Slippage Index (KSI)** — un indicateur de trading puissant conçu pour identifier les mouvements de prix inhabituels, les déséquilibres de volume et les événements potentiels de liquidité avant qu'ils ne deviennent évidents sur le graphique.
Conçu pour les traders qui analysent **la structure du marché, le comportement du volume, la volatilité et l'activité institutionnelle**, le KSI combine l'expansion de la plage et la dynamique du volume pour mesurer les conditions anormales du marché.
## 🔥 Caractéristiques Clés
✅ **Calcul de l'Indice de Glissement Cinétique**
* Mesure la relation entre le mouvement des prix et le volume échangé.
* Détecte les situations où le prix évolue de manière disproportionnée par rapport au comportement normal du volume.
* Aide à identifier les stress potentiels de liquidité, l'activité de marché agressive et les dynamiques inhabituelles.
✅ **Détection Adaptative des Pics**
* Calcule automatiquement les niveaux dynamiques de pics basés sur le comportement récent du marché.
* Utilise une analyse de déviation statistique pour mettre en évidence les événements extrêmes du marché.
* S'adapte aux conditions de volatilité changeantes sans nécessiter d'ajustements manuels constants.
✅ **Alertes de Pics en Temps Réel 🚨**
* Recevez des notifications lorsque des divergences anormales de volume/plage se produisent.
* Aide les traders à identifier rapidement les conditions potentielles de cassure, les saisies de liquidité ou la pression soudaine du marché.
✅ **Analyse du Volume & du Flux 📊**
* Suit le volume actuel comparé à sa moyenne EMA.
* Met en évidence lorsque l'activité de trading est exceptionnellement élevée.
* Inclut une analyse delta cumulative pour visualiser la pression d'achat et de vente.
✅ **Confirmation par Ligne de Signal 📈**
* Le calcul lissé du signal aide à identifier les changements dans le momentum du KSI.
* La visualisation par histogramme vert/rouge facilite la lecture des changements de pression du marché.
## 🕒 Intelligence des Sessions de Trading
KSI inclut un suivi automatique des sessions de marché :
🌏 Session Asie
🇬🇧 Session Londres
🇺🇸 New York AM
☕ Pause déjeuner New York
🌆 New York PM
L'affichage intégré de la killzone aide les traders à comprendre quand la liquidité et la volatilité sont généralement plus élevées.
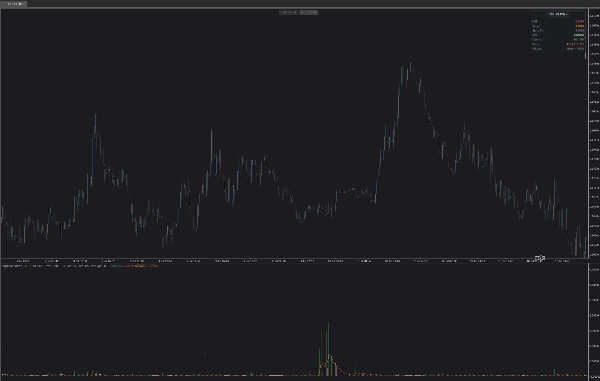
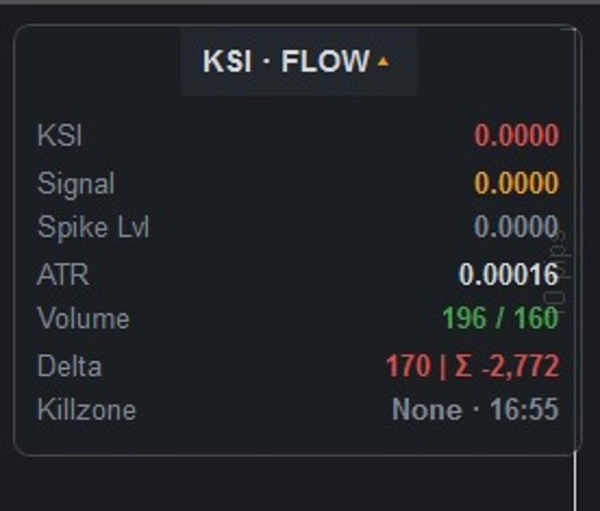
## 📌 Panneau d'Information Professionnel
Le tableau de bord intégré offre une vue claire directement sur votre graphique :
📍 Valeur KSI actuelle
📍 Niveau de signal
📍 Seuil adaptatif des pics
📍 Lecture de la volatilité ATR
📍 Volume actuel vs volume moyen
📍 Delta & delta cumulatif
📍 Session de trading active / killzone
Le panneau peut être :
* ✅ Positionné dans n'importe quel coin du graphique
* ✅ Réduit ou étendu
* ✅ Ajusté avec une opacité personnalisée
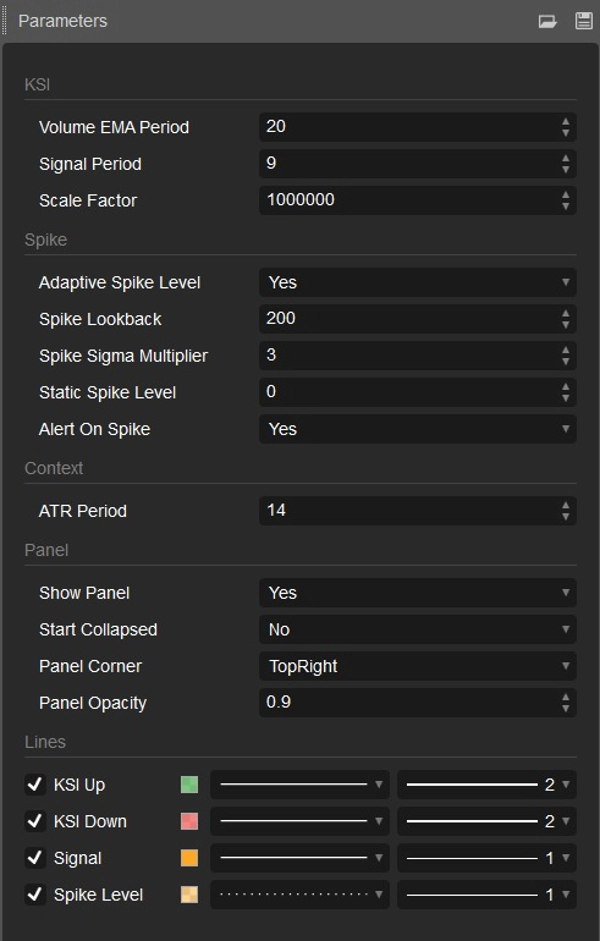
## ⚙️ Paramètres Personnalisables
Affinez le KSI pour tout style de trading :
🔧 Période EMA du volume
🔧 Période du signal
🔧 Facteur d'échelle
🔧 Détection de pics adaptative ou fixe
🔧 Période de rétroaction des pics
🔧 Multiplicateur de sensibilité des pics
🔧 Période ATR
🔧 Paramètres d'apparence du panneau
## 🎯 Conçu Pour
✔ Traders Forex
✔ Traders Futures
✔ Traders Crypto
✔ Scalpers
✔ Traders Day
✔ Analystes de la structure du marché
✔ Traders recherchant une confirmation basée sur le volume
## 💡 Comment les Traders Utilisent le KSI
Le KSI peut aider à identifier :
⚡ Activité de marché inhabituelle
⚡ Pression potentielle de cassure
⚡ Divergence volume-prix
⚡ Événements de liquidité
⚡ Changements de momentum
⚡ Opportunités de trading à haute volatilité
Combinez le KSI avec votre stratégie existante pour obtenir une vision plus claire de **quand le marché évolue normalement — et quand quelque chose d'inhabituel se produit.**
📈 Tradez plus intelligemment. Comprenez la pression du marché. Détectez l'activité cachée avec l'Indice de Glissement Cinétique.
Résumé
The indicator includes volume and flow analysis by comparing current volume to its exponential moving average (EMA) and incorporates cumulative delta analysis to visualize buying and selling pressure. A smooth signal line and histogram help confirm changes in KSI momentum, making shifts in market pressure easier to interpret.
KSI tracks major trading sessions—Asia, London, and New York (AM, Lunch, PM)—highlighting periods of higher liquidity and volatility. A professional information panel displays key metrics such as current KSI value, signal level, adaptive spike threshold, ATR volatility, volume comparisons, delta values, and active trading sessions. This panel is customizable in position, size, and opacity.
Settings allow fine-tuning of volume EMA period, signal period, scale factor, spike detection parameters, ATR period, and panel appearance. KSI is suitable for forex, futures, and crypto traders, including scalpers, day traders, and market structure analysts seeking volume-based confirmation and insights into unusual market activity, breakout pressure, liquidity events, and momentum changes.
Discussion
Avis clients
5 | 0 % | |
4 | 100 % | |
3 | 0 % | |
2 | 0 % | |
1 | 0 % |
Questions fréquentes
Plus de cet auteur
















Prix