
Side Volume Profile
Indicateur
11 achats
Version 1.0, Aug 2025
Windows, Mac
4.3
Avis : 3
Depuis le 26/05/2025
385.09M
Volume tradé
60.66K
Pips gagnés
14
Ventes
1.4K
Installations gratuites
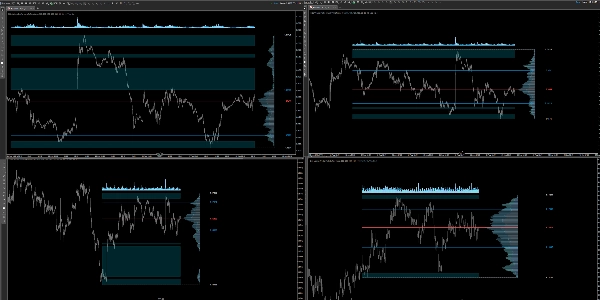
Description
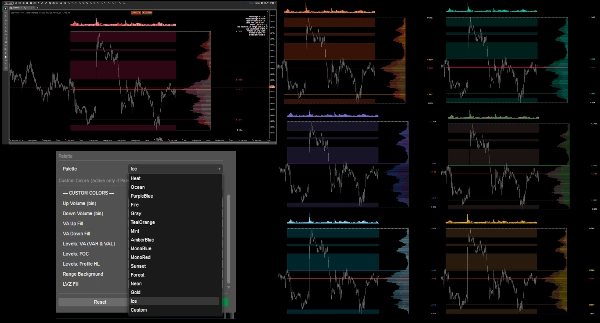
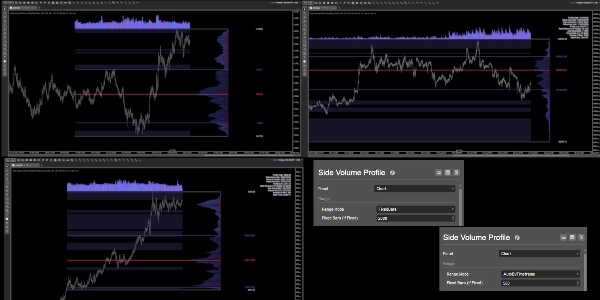
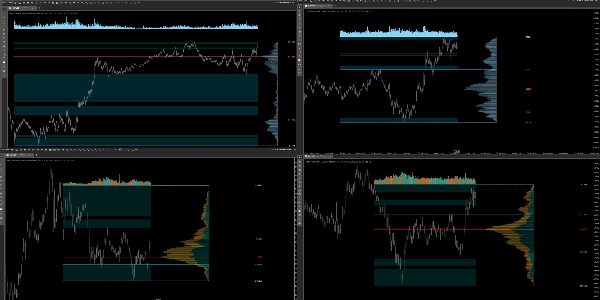
Un profil de volume côté droit, toujours fixé aux dernières barres et qui ne saute pas lorsque vous déplacez le graphique. Il calcule le volume par prix sur une plage choisie (automatique selon la période ou un nombre fixe de barres), affiche le POC, VAH/VAL, les limites du profil (Haut/Bas), met en évidence les zones de faible volume (LVZ) et dessine un histogramme de volume avec une EMA au-dessus de la plage (décalage en pips). Comprend un panneau de statistiques en haut à droite, plusieurs palettes à fort contraste plus des couleurs personnalisées, une opacité globale des bacs, des contrôles de largeur/décalage, et une épaisseur/style par ligne. Conçu pour la lisibilité et la performance.
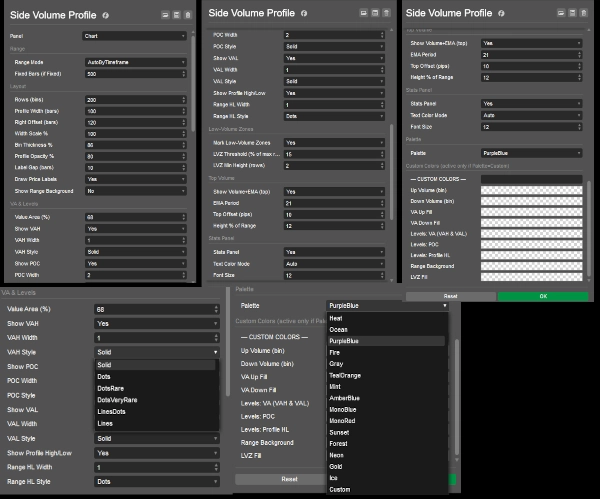
- Plage : AutoByTimeframe ou FixedBars.
- Disposition : Lignes (bacs), largeur du profil / échelle de largeur, décalage à droite, épaisseur des bacs, écart des étiquettes, opacité du profil ; arrière-plan optionnel de la plage.
- VA & Niveaux : Pourcentage de la zone de valeur, bascule VAH/POC/VAL, largeur et style de ligne par niveau ; Haut/Bas du profil.
- Zones de faible volume : Seuil (% de la ligne max) et hauteur minimale (lignes).
- Volume supérieur : Période EMA, hauteur (% de la plage), décalage par défaut 10 pips.
- Palette/Personnalisé : Choisissez un thème ou définissez vos propres couleurs (VAH = VAL).
- Panneau de statistiques : Bascule, taille de la police
Documentation de l'indicateur
Résumé
Résumé IA
Side Volume Profile is a right-anchored volume profile indicator designed for cTrader that displays volume-by-price data over a selectable range, either automatically by timeframe or a fixed number of bars. It visualizes key volume levels including Point of Control (POC), Value Area High (VAH), Value Area Low (VAL), and profile bounds (high/low). The indicator highlights low-volume zones (LVZ) based on configurable thresholds and minimum heights. It also features a volume histogram with an exponential moving average (EMA) offset in pips above the profile range.
Users can customize the layout with controls for row bins, profile width and scale, right offset, bin thickness, label gaps, and opacity. Line widths and styles for VAH, POC, VAL, and profile bounds are adjustable. Multiple high-contrast color palettes and custom color options are available. A toggleable top-right statistics panel provides summary data with adjustable font size.
The indicator supports various markets including Forex, indices, commodities, cryptocurrencies, and stocks, with tags referencing symbols like BTCUSD, EURUSD, GBPUSD, XAUUSD, NAS100, and USDJPY. It is built for readability and performance, maintaining a stable position on the chart without shifting when panning.
Profil de l'indicateur
Avis clients
4.3
Avis : 3
5 | 33 % | |
4 | 67 % | |
3 | 0 % | |
2 | 0 % | |
1 | 0 % |
Avis clients
Discussion
Questions fréquentes
BTCUSD
Forex
Indices
EURUSD
Commodities
GBPUSD
NZDUSD
Prop
Fair Value Gap
SMC
Crypto
Stocks
XAUUSD
NAS100
USDJPY
VWAP
Les produits disponibles sur cTrader Store, notamment les bots de trading, les indicateurs et les plug-ins, sont fournis par des développeurs tiers et mis à disposition à titre informatif et à des fins d'accès technique uniquement. cTrader Store n'est pas un courtier et ne fournit aucun conseil en investissement, aucune recommandation personnelle ni aucune garantie quant aux performances futures.


Prix
Depuis le 26/05/2025
385.09M
Volume tradé
60.66K
Pips gagnés
14
Ventes
1.4K
Installations gratuites