
Description
Woodie_CCI_pro est une boîte à outils avancée basée sur le CCI construite autour de la méthodologie classique Woodie CCI.
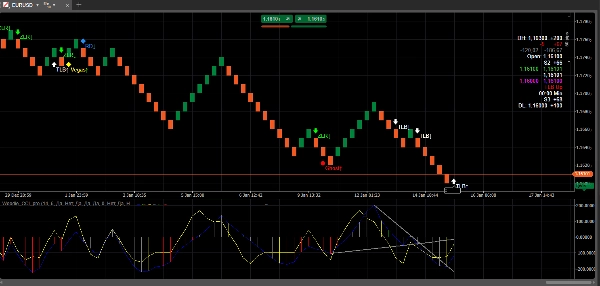
Il trace un CCI de style Woodie avec lissage et met en évidence les motifs Woodie les plus importants avec des signaux clairs sur le graphique, des marqueurs d'oscillateur optionnels, et une guidance par ligne de tendance TLB optionnelle dans le panneau CCI pour un meilleur contexte et une prise de décision plus rapide.
Conçu pour une visibilité historique claire : tous les signaux sont tracés sur l'historique, les étiquettes affichent le nom exact du motif, et le rendu des lignes de tendance est optimisé pour éviter la distorsion de l'échelle et les « artefacts de ligne ».
Fonctionnalités principales
1) Détection de motifs Woodie (signaux automatiques)
Woodie_CCI_pro détecte et étiquette les motifs Woodie suivants :
- ZLR (Rejet de la ligne zéro)
- Ghost
- HFE (Crochet depuis l'extrême)
- TLB (Cassure de ligne de tendance)
- HTLB (Cassure de ligne de tendance horizontale)
- RD (Divergence inverse)
- Famir
- Vegas Trade (VT)
Chaque signal est dessiné avec des marqueurs sensibles à la direction (Haut/Bas) et une étiquette (par exemple, ZLR↑, TLB↓) pour que vous sachiez toujours exactement ce qui s'est déclenché.
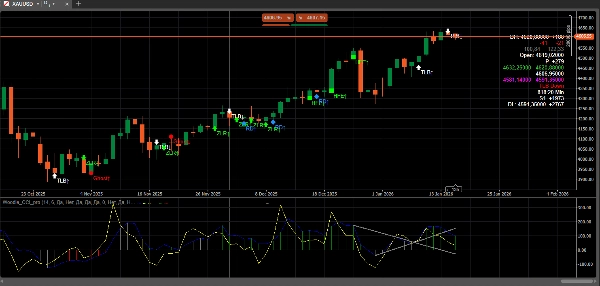
2) Signaux directement sur le graphique des prix
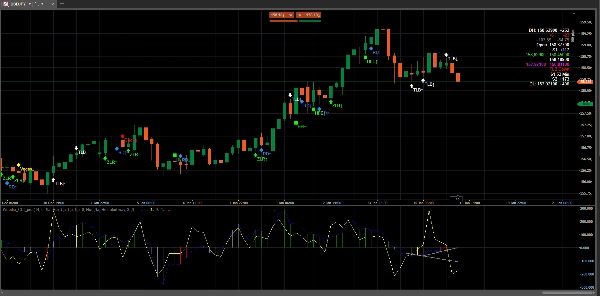
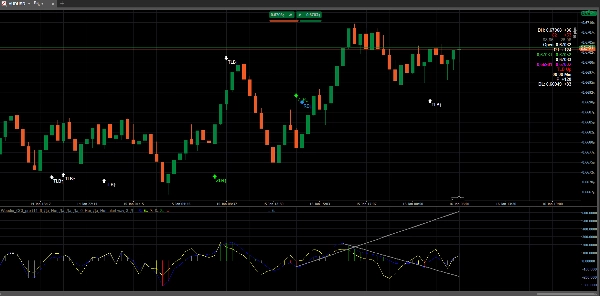
Les signaux sont affichés sur le graphique des prix sous forme de flèches/icônes avec des étiquettes textuelles pour une clarté maximale lors de la revue de l'historique et des configurations en direct.
Les options incluent :
- afficher/masquer les signaux sur le graphique
- afficher/masquer les étiquettes
- format d'étiquette compact (exemple :
RD↑) - décalage étiquette/marqueur en pips pour un placement propre
3) Marqueurs d'oscillateur optionnels
Si vous préférez la sensation classique Woodie, vous pouvez activer les marqueurs de signal optionnels dans le panneau CCI (points/dots).
Ceci est entièrement optionnel afin que l'oscillateur reste propre lorsque vous souhaitez uniquement des signaux au niveau du graphique.
4) Guidance par ligne de tendance TLB dans le panneau CCI (pas de problèmes d'échelle)
Pour une meilleure reconnaissance de la structure, l'indicateur peut tracer des lignes de tendance TLB dans le panneau CCI :
- Lignes TLB actuelles (guidage du dernier swing au swing)
- Option Keep On Signal pour conserver la ligne de tendance utilisée au moment d'une cassure pour une revue ultérieure
Le rendu est conçu pour rester propre sur l'historique et éviter les artefacts de « bord » ou le redimensionnement forcé.
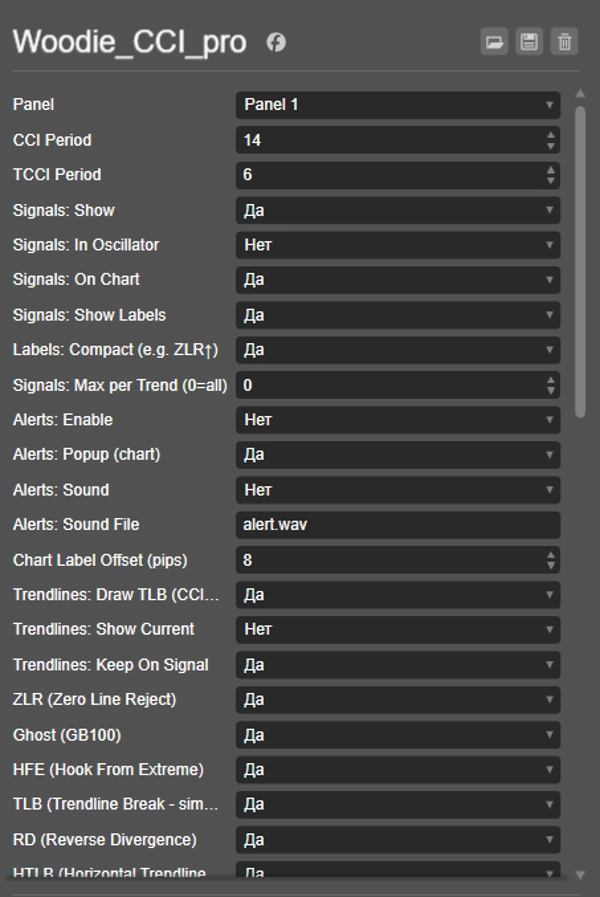
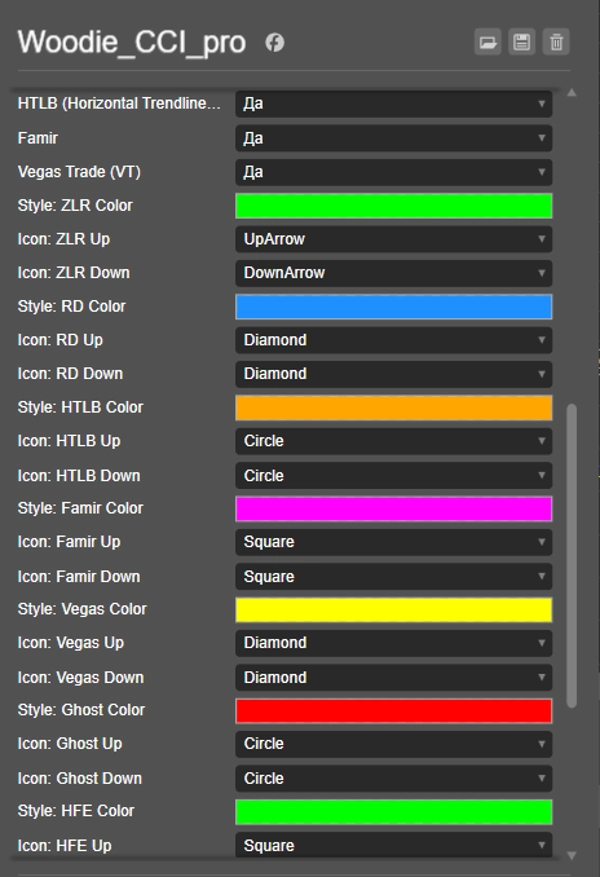
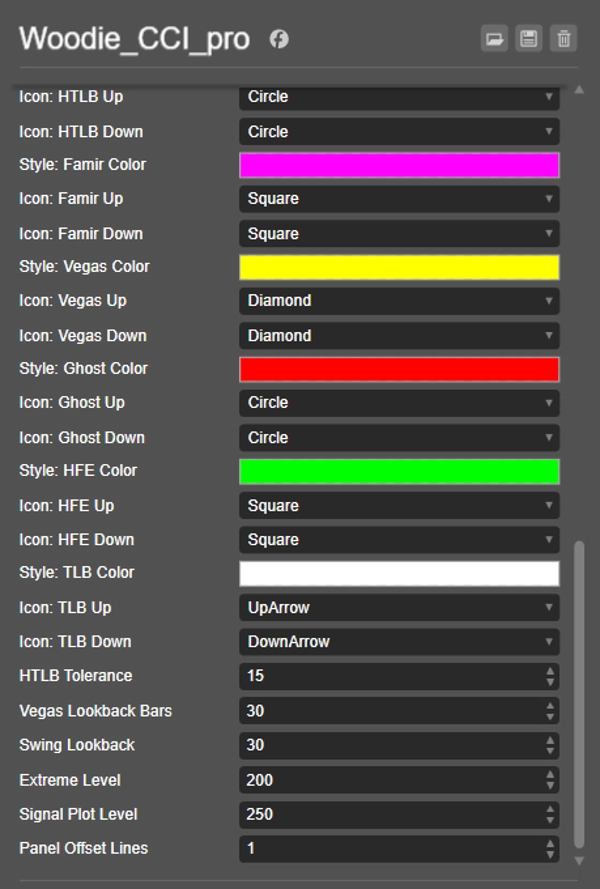
5) Contrôles de style et de visualisation (par motif)
Vous pouvez personnaliser l'apparence visuelle par motif :
- type d'icône pour Haut/Bas
- couleur par motif (lorsque supporté)
- étiquettes compactes vs complètes
6) Alertes (optionnel)
Activez les alertes pour les signaux sélectionnés :
- message popup sur le graphique
- notification sonore optionnelle (si prise en charge par votre configuration de plateforme)
7) Filtre « Max Signals Per Trend » (optionnel)
Pour réduire le bruit, vous pouvez limiter les signaux par tendance :
Max per Trend (0 = illimité)- compte uniquement les signaux alignés avec la tendance actuelle (basé sur le signe TCCI)
Flux de travail typique
- Ajoutez Woodie_CCI_pro à un graphique.
- Activez Signaux sur le graphique et Étiquettes pour étudier rapidement le comportement des motifs sur l'historique.
- Activez les lignes de tendance TLB si vous souhaitez un contexte structurel pour les cassures et les trades de continuation.
- Activez éventuellement les marqueurs d'oscillateur si vous préférez la confirmation classique par point Woodie.
Notes & Philosophie
- Cet indicateur vise à être pratique et lisible plutôt que « sur-ajusté ».
- Certains motifs (en particulier ceux basés sur des lignes comme TLB/HTLB/RD/Vegas) incluent des tolérances/lookbacks ajustables car la structure du marché diffère selon les symboles/périodes.
- La sortie visuelle est optimisée pour un historique propre, une échelle stable et un encombrement minimal.
Résumé
Avis clients
5 | 50 % | |
4 | 50 % | |
3 | 0 % | |
2 | 0 % | |
1 | 0 % |


