
WaveWeisBarForce
指标
169 下载
版本 1.0, Dec 2025
Windows 版、Mac 版
5.0
评价:2
说明
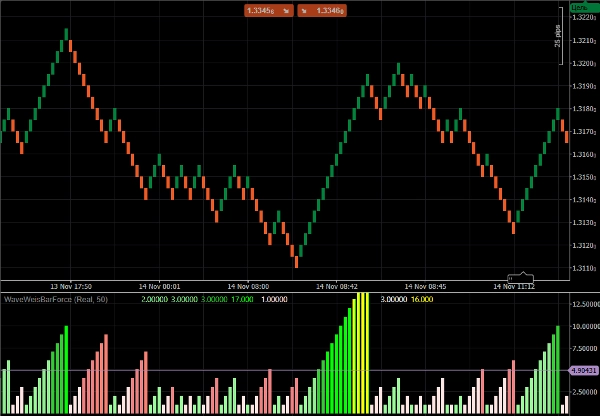
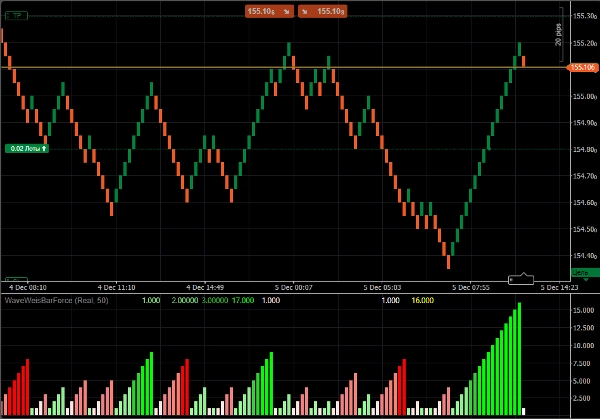
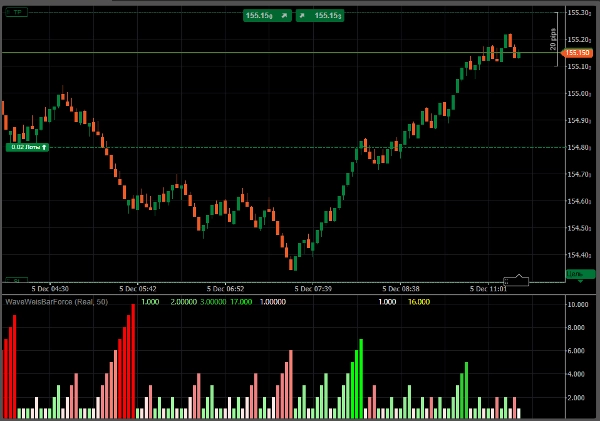
Wave Weis Bar Force - 是一个应用成交量波(Weis)逻辑来确定市场累积和方向变化的指标。
它在趋势保持不变时汇总成交量。当方向改变时,新波浪开始,累积被重置。
强度按级别计算,根据当前波浪成交量与最近最大累积的比率。它作为一个额外的过滤器,在趋势策略中表现良好。
摘要
AI 摘要
Wave Weis Bar Force is a technical indicator that applies the concept of Volume Waves (Weis) to identify market accumulation phases and detect changes in market direction. It aggregates volume data while the current trend persists, resetting accumulation when a new wave begins with a trend reversal. The indicator calculates intensity levels based on the ratio of the current wave's volume to the largest recent accumulation, providing a quantitative measure of volume strength. This functionality serves as an additional filter and is particularly useful in trending market strategies. The indicator supports analysis across multiple markets including Forex, Crypto, and Stocks, and is applicable to trading approaches such as breakout and scalping strategies.
指标配置
客户评价
5.0
评价:2
5 | 100 % | |
4 | 0 % | |
3 | 0 % | |
2 | 0 % | |
1 | 0 % |
客户评价
December 10, 2025
WaveWeisBarForce blends Weis Wave logic with bar-strength analysis to show real buying/selling force. Clean histogram, stable performance, great for confirming impulses and spotting exhaustion. Useful for Wyckoff, VSA and intraday momentum traders.
讨论
常见问答
Forex
Breakout
Scalping
Crypto
Stocks
cTrader Store 提供的所有产品,包括交易机器人、指标和插件,均由第三方开发者提供,仅供信息参考和技术访问之用。cTrader Store 并非经纪商,不提供投资建议、个人推荐或任何未来业绩保证。
该作者的其他作品


价格
注册日期 24/10/2025
1.43M
交易量
4.79K
盈利点数
2
销售
317
免费安装