
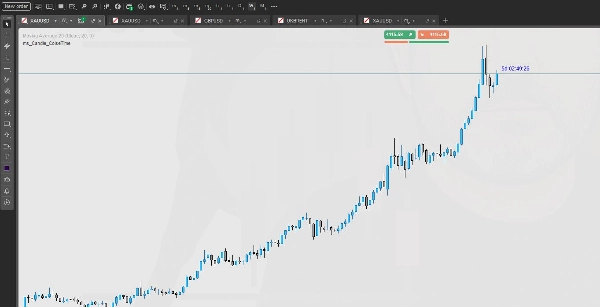
ms_Candle_ColseTime
Indikator
506 unduhan
Versi 1.0, Oct 2025
Windows, Mac
Deskripsi
Harga: Gratis
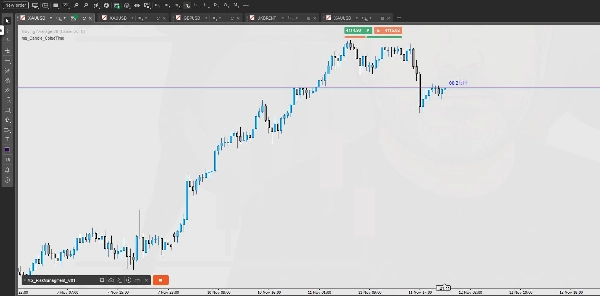
Jangan pernah kehilangan jejak waktu lilin Anda lagi!
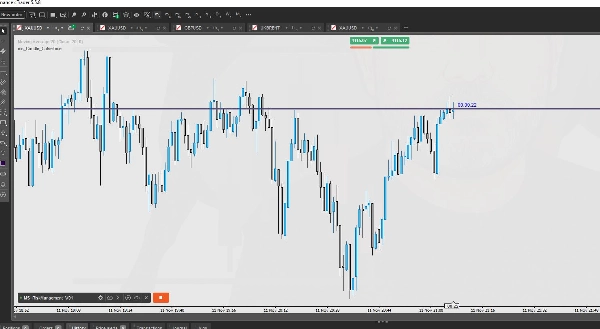
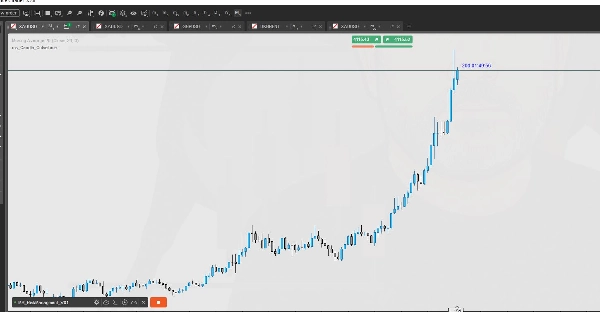
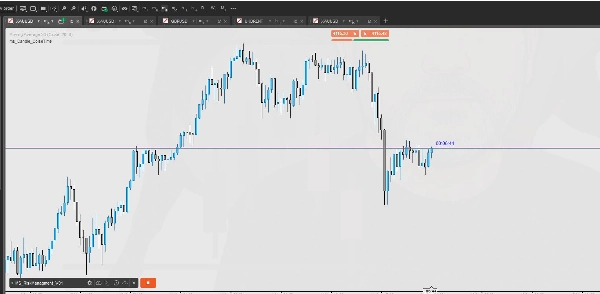
Indikator Waktu Lilin Tersisa menampilkan waktu tepat tersisa sampai lilin saat ini ditutup — di semua kerangka waktu dan instrumen apa pun — yang diperbarui secara dinamis saat pasar bergerak.
💡 Fitur Utama
- Dukungan Multi-Kerangka Waktu — Bekerja mulus pada semua kerangka waktu (dari grafik 1 menit hingga 1 bulan).
- Hitung Mundur Waktu Nyata — Terus diperbarui setiap tick, sinkron sempurna dengan jam pasar.
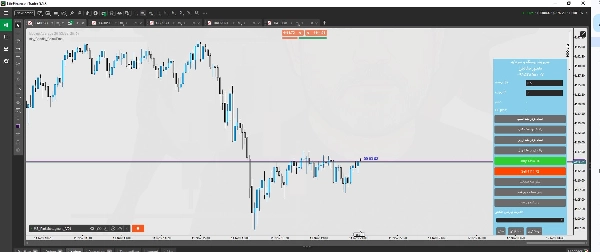
- Tampilan Mengambang — Timer bergerak dinamis bersama harga pasar langsung, tetap terlihat di tempat yang paling Anda butuhkan.
- UI Ringkas & Jelas — Tipografi bersih dan posisi yang disesuaikan otomatis untuk keterbacaan maksimal.
- Posisi yang Dapat Disesuaikan — Anda dapat dengan mudah memilih di mana menampilkan hitung mundur (misalnya, dekat harga, kanan atas, kiri bawah).
- Ringan & Cepat — Penggunaan CPU minimal; ideal untuk trader yang menjalankan banyak grafik atau indikator.
⚙️ Cara Kerja
- Indikator secara otomatis mendeteksi kerangka waktu grafik Anda saat ini dan waktu server.
- Menghitung waktu tersisa tepat sampai lilin saat ini ditutup.
- Memperbarui secara waktu nyata — bahkan saat pasar bergerak tick demi tick.
🧭 Mengapa Trader Menyukainya
- Sempurna untuk scalper dan trader intraday yang menunggu penutupan lilin sebelum masuk posisi.
- Membuat Anda sadar waktu untuk breakout, konfirmasi, dan sinyal penutupan bar.
- Tanpa lag, tanpa penundaan refresh — presisi waktu nyata murni.
⚠️ Kompatibilitas
- Platform: cTrader Desktop
- Bekerja pada: Semua simbol dan kerangka waktu
- Penggunaan yang Direkomendasikan: Gaya trading apa pun — Scalping, Day Trading, Swing Trading
Cara Menggunakan Indikator Waktu Lilin Tersisa
Indikator ini tidak memerlukan konfigurasi khusus apapun.
Cukup pasang pada grafik Anda, dan secara otomatis akan menampilkan waktu tersisa lilin saat ini berdasarkan kerangka waktu yang dipilih.
Ini bekerja pada semua kerangka waktu.
Ringkasan
Ringkasan AI
The ms_Candle_ColseTime indicator for cTrader Desktop provides a real-time countdown of the remaining time until the current candle closes on any chart. It automatically detects the chart’s timeframe and server time, then continuously updates the exact time left until candle closure with each market tick. This indicator supports all timeframes, from 1-minute to monthly charts, and works on all trading instruments available on the platform.
Key features include a floating display that moves dynamically with the live market price, customizable positioning options (e.g., near price, top-right, bottom-left), and a compact, clear user interface designed for readability. It is lightweight and optimized for minimal CPU usage, making it suitable for traders running multiple charts or indicators simultaneously.
This tool is particularly useful for scalpers and intraday traders who rely on precise candle close timing for entries, breakouts, confirmations, and bar close signals. It requires no special configuration—simply attach it to a chart to start viewing the countdown. The indicator supports all trading styles including scalping, day trading, and swing trading.
Profil indikator
Ulasan pelanggan
0.0
Ulasan: 0
Ulasan pelanggan
Belum ada ulasan untuk produk ini. Sudah mencobanya? Jadilah pemberi ulasan pertama!
Diskusi
Pertanyaan umum
Forex
Produk-produk yang tersedia melalui cTrader Store, termasuk bot trading, indikator, dan plugin, disediakan oleh pengembang pihak ketiga serta hanya ditujukan untuk akses teknis dan informasi. cTrader Store bukan broker dan tidak menyediakan saran investasi, rekomendasi pribadi, atau jaminan apa pun tentang kinerja di masa mendatang.
Produk lain dari penulis ini


Harga
20.18M
Volume trading
105.55K
Pip dimenangkan
1K
Instal gratis