Deskripsi
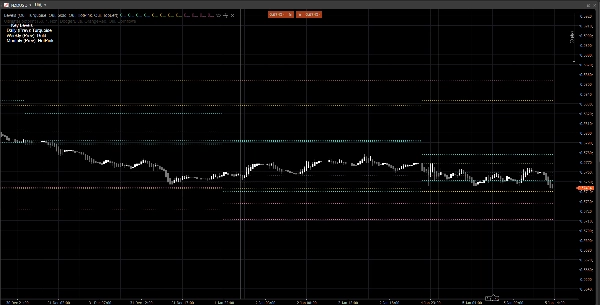
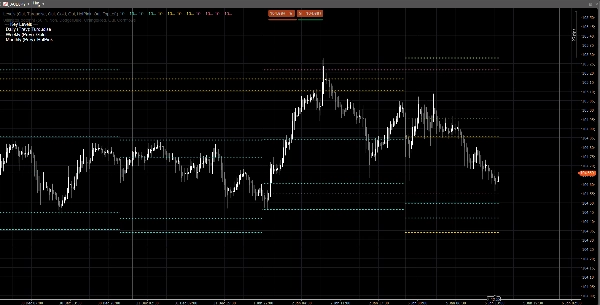
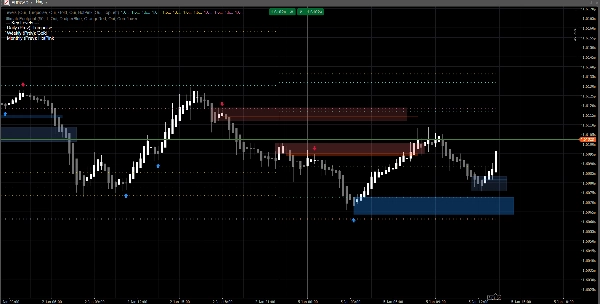
Zona Aksi Harga adalah indikator ringan tanpa gangguan yang menampilkan level kunci Harian, Mingguan, dan Bulanan sebelumnya langsung pada grafik Anda.
Ini menampilkan:
- Hari Sebelumnya: Tinggi / Rendah / Buka / Tutup
- Minggu Sebelumnya: Tinggi / Rendah / Buka / Tutup
- Bulan Sebelumnya: Tinggi / Rendah / Buka / Tutup
Level-level ini banyak digunakan sebagai zona reaksi, referensi likuiditas, dan jangkar konteks untuk struktur pasar, entri, target, dan penempatan risiko.
Mengapa ini berguna
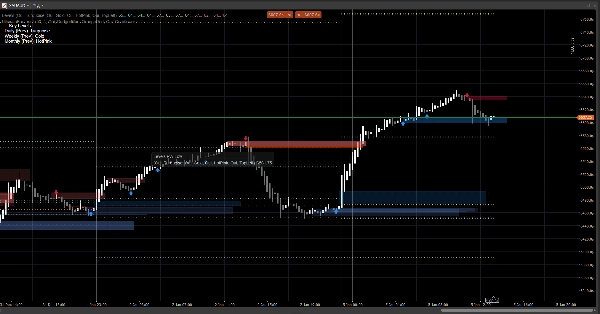
- Langsung melihat level referensi timeframe yang lebih tinggi tanpa mengganti grafik
- Membantu Anda membingkai aksi harga intraday di sekitar PDH/PDL, PWH/PWL, PMH/PML
- Visual yang bersih: level tetap konstan untuk sesi/minggu/bulan saat ini
- Bekerja pada simbol dan timeframe apa pun
Kustomisasi
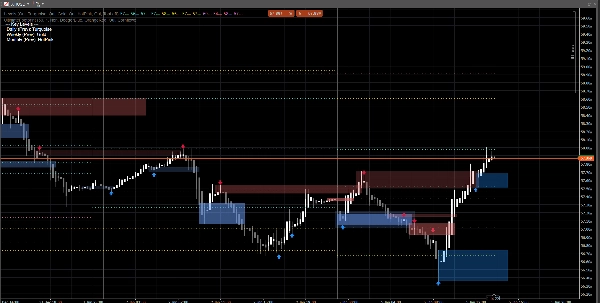
Anda dapat mengaktifkan atau menonaktifkan setiap timeframe secara mandiri:
- Tampilkan Harian / Mingguan / Bulanan
- Atur warna khusus untuk setiap grup
- Aktifkan legenda sederhana, dengan posisi sudut yang dapat dipilih
Catatan teknis
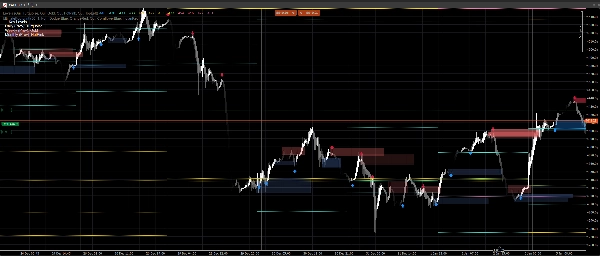
- Level dihitung menggunakan lilin Harian/Mingguan/Bulanan yang selesai sebelumnya (bukan yang sedang terbentuk saat ini).
- Ini mencegah repainting dan menjaga level tetap stabil selama sesi.
Penafian
Indikator ini disediakan hanya untuk pemetaan grafik dan dukungan pengambilan keputusan. Ini tidak menghasilkan sinyal beli/jual dan bukan nasihat keuangan. Selalu kelola risiko dan validasi dengan data Anda sendiri.
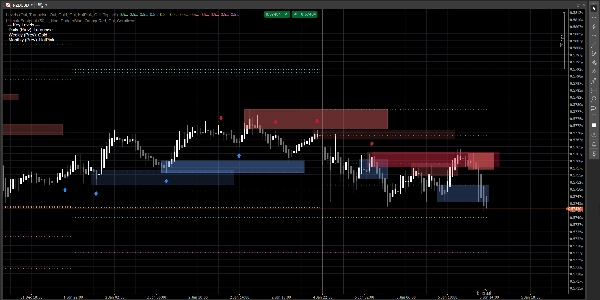
Sinyal pada grafik dihasilkan oleh indikator Ultimate Footprint yang tersedia di profil saya.