
Deskripsi
🚀 Lebih dari 10.000 trader sudah menggunakan indikator TOP kami 🏆
👉 Dapatkan semua sistem TOP kami di sini:
_______________________________________________
📌 Indikator Struktur Pasar
· ✅ AdvancedMarket Structure: Bos, Choch, SwinLevels, Order Blocks, Market Structure& Liquidity Finder
· 🔄 Analisis Struktur Pasar Dinamis dari Titik Balik
· 🧱 Order Block
· ⛓️ BOS & CHOCH
· 🧠 ICT Power of 3
_______________________________________________
🔚 Sistem Keluar Pintar
_______________________________________________
📐 Indikator ZigZag
· 🔍 Proyeksi Likuiditas Harga ZigZag
· ➖ ZigZag
· 🎯 Pelacak Ekstremitas Zig-Zag
_______________________________________________
🧱 Indikator Support & Resistance
· 🟩 Garis Support & Resistance SmartTrend
· 🧱 Semua Level Support dan Resistance
_______________________________________________
📊 Indikator Tren & Saluran
· 📊 Supertrend
· 🔁 Rata-Rata Bergerak Reaktif
_______________________________________________
💧 Alat Volume & Likuiditas
· 🔍 Celah Nilai Wajar Momentum
_______________________________________________
⚡ Indikator Momentum & RSI
· 📈 Pemicu Tren RSI
· 🔎 Pelacak Bias Lilin Multi-Level
Tracker
_______________________________________________
🔮 Alat Prediksi & Proyeksi
· 📐 Prediksi Berdasarkan Linreg& ATR
· 📏 Regresi Linear Fibonacci Multi-timeframe
· 📈 Proyektor Aliran Pasar Berbasis Volume
📊 Sistem Regresi Breakout Squeeze -🚀
🎯 Apa itu dan untuk apa? ❓
Indikator ini menggabungkan dua sistem pelengkap untuk mengidentifikasi peluang trading dengan probabilitas tinggi:
- Sistem Squeeze (Kompresi Volatilitas): 🔍 Mendeteksi momen ketika pasar "terkompresi" dan akan meledak ke arah mana pun 💥
- Sistem Saluran Tren (Regresi Linear): 📈 Menunjukkan tren dominan dan batas dukungan/resistensi dinamisnya
🔍 Bagaimana cara kerjanya? ⚙️
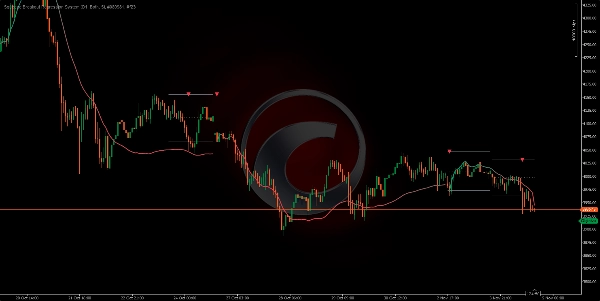
BAGIAN 1: Deteksi Squeeze
Indikator menganalisis timeframe yang lebih tinggi (default: Harian) dan mencari lilin dengan rentang (selisih antara tinggi dan rendah) terkecil dalam:
• 7 periode = "Squeeze Pendek" (kompresi pendek)
• 10 periode = "Squeeze Diperpanjang" (kompresi diperpanjang - lebih kuat) 💪
Apa yang terjadi saat mendeteksi Squeeze?
- Ia menggambar tiga garis horizontal:
o Garis atas = Resistensi (level yang harus ditembus ke atas) ↗️
o Garis bawah = Dukungan (level yang harus ditembus ke bawah) ↘️
o Garis titik tengah = Pivot (titik tengah) ⚖️ - Ia menunggu breakout:
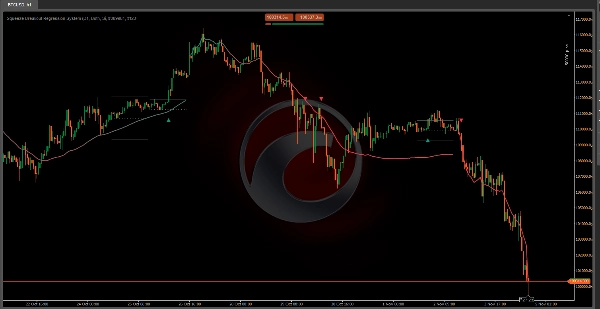
o Jika harga menembus resistensi ke atas → Sinyal BULLISH (segitiga hijau) 🟢
o Jika harga menembus dukungan ke bawah → Sinyal BEARISH (segitiga merah) 🔴
Filter pintar: 🧠
• Untuk sinyal bullish: Harga harus terlebih dahulu di bawah pivot, lalu naik
• Untuk sinyal bearish: Harga harus terlebih dahulu di atas pivot, lalu turun
• Ini menghilangkan sinyal palsu saat harga sudah jauh dari rentang ❌
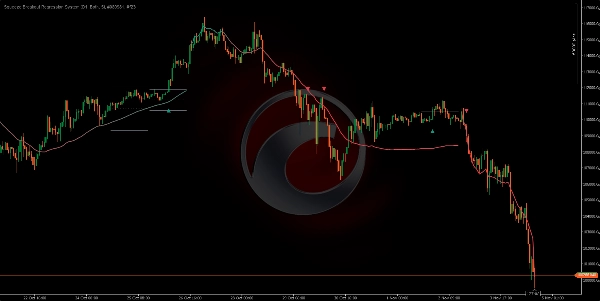
BAGIAN 2: Saluran Tren Regresi
Ia menghitung secara matematis garis tren optimal menggunakan regresi linear dan menggambar saluran dinamis dengan:
• Garis tengah tebal (hijau jika naik, merah jika turun) 🎨
- Peringatan Breakout 🚨
Menampilkan Sinyal Breakout
• Fungsinya: Menampilkan/menyembunyikan segitiga sinyal
• Dampak: Jika dimatikan, panah tidak akan terlihat tapi kotak dan garis tetap terlihat
• Rekomendasi: Selalu aktifkan ✅
Warna Breakout Bullish/Bearish
• Fungsinya: Mengubah warna sinyal bullish/bearish
• Dampak: Hanya visual, tidak mempengaruhi deteksi
• Rekomendasi: Hijau untuk bullish, Merah untuk bearish (standar) 🟢🔴 - Saluran Tren (Trend Channel) 📊
Metode Saluran
• Pilihan: Bergulir / Statis
• Fungsinya:
o Bergulir: Saluran menyesuaikan bar demi bar (fluid) 🔄
o Statis: Saluran digambar sekali di awal periode dan diperpanjang (garis lurus) ➖
• Dampak: Bergulir lebih dinamis, Statis lebih jelas untuk melihat tren awal
• Rekomendasi: Bergulir untuk pelacakan waktu nyata ⌚
Jenis Anchor
• Pilihan: Periodik / Bar Pertama
• Fungsinya:
o Periodik: Mengatur ulang perhitungan setiap periode baru (mingguan, bulanan, dll.) 📅
o Bar Pertama: Menghitung dari bar pertama di grafik (tidak pernah mengatur ulang) 🏁
• Dampak: Periodik memberikan saluran bersih setiap periode, Bar Pertama menunjukkan tren global
• Rekomendasi: Periodik untuk analisis terstruktur 🧱
Periode Saluran
• Fungsinya: Seberapa sering perhitungan saluran diatur ulang
• Default: Mingguan (Weekly) 🗓️
• Dampak:
o Periode pendek (Harian) → Saluran berubah sering, mengikuti perubahan cepat
o Periode panjang (Bulanan) → Saluran lebih stabil, menunjukkan tren dasar
• Rekomendasi: Mingguan adalah keseimbangan sempurna ⚖️
Sumber Harga
• Pilihan: Close / Open / High / Low / Typical / Weighted
• Fungsinya: Harga mana yang digunakan untuk menghitung saluran
• Dampak: Close paling sering digunakan (harga penutupan), Typical melunakkan perhitungan
• Rekomendasi: Close untuk presisi, Typical untuk pelunakan 🎯
Pengali Deviasi
• Fungsinya: Mengalikan deviasi standar untuk membuat saluran lebih lebar atau sempit
• Default: 1.0
• Dampak:
o Nilai rendah (0.5-0.8) → Saluran sempit, lebih banyak sinyal sentuhan tapi juga lebih banyak sinyal palsu
o Nilai tinggi (1.5-2.0) → Saluran lebar, lebih sedikit sentuhan tapi lebih dapat diandalkan
• Rekomendasi: 1.0 adalah keseimbangan optimal ⚖️ - Warna Saluran 🎨
Warna Dinamis
• Fungsinya: Mengubah warna saluran sesuai tren (hijau jika naik, merah jika turun)
• Dampak: Jika dimatikan, hanya menggunakan satu warna (Warna Uptrend)
• Rekomendasi: Aktifkan untuk mengenali tren dengan cepat 🚦
Warna Uptrend/Downtrend
• Fungsinya: Menentukan warna untuk uptrend/downtrend
• Dampak: Hanya visual
• Rekomendasi: Hijau/Merah (klasik) 🟢🔴
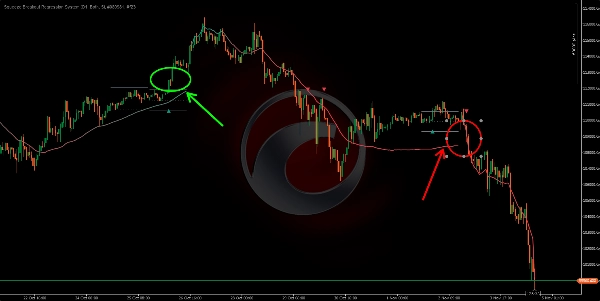
🟢 OPERASI LONG 📈
- Deteksi Squeeze:
• Tiga garis horizontal muncul (dukungan, pivot, resistensi)
• Harga terkompresi di antara level-level ini - Persiapan Breakout:
• Harga berada di bawah pivot (garis titik tengah)
• Ini mengaktifkan kondisi untuk mencari breakout bullish - KONFLUENSI KUNCI - Momen Masuk: 🎯
• ✅ Segitiga hijau muncul (breakout bullish terkonfirmasi) 🟢
• ✅ Saluran Regresi berwarna HIJAU (tren naik terkonfirmasi) 📗
• ✅ Harga menembus garis squeeze atas ↗️
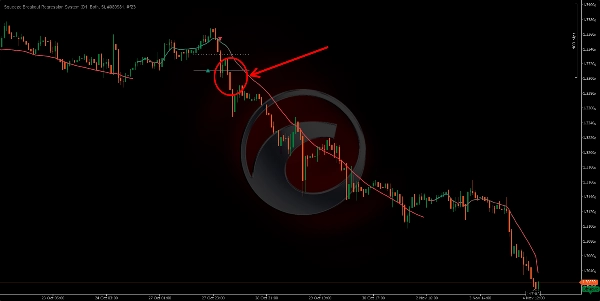
🔴 OPERASI SHORT 📉
- Deteksi Squeeze:
• Tiga garis horizontal muncul kembali
• Zona kompresi baru teridentifikasi - Persiapan Breakout Bearish:
• Harga berada di atas pivot (garis titik)
• Ini mengaktifkan pencarian breakout bearish - KONFLUENSI KUNCI - Momen Masuk: 🎯
• ✅ Segitiga merah muncul (breakout bearish terkonfirmasi) 🔴
• ✅ Saluran Regresi berwarna MERAH (tren turun terkonfirmasi) 📕
• ✅ Harga menembus garis squeeze bawah ↘️
Ringkasan
The Trend Channel System uses linear regression to calculate the dominant trend and dynamically draws a channel with color-coded trend direction (green for uptrend, red for downtrend). It offers configurable options such as rolling or static channels, periodic or continuous anchoring, channel period, price source, and deviation multiplier to adjust channel width and responsiveness.
The indicator supports breakout alerts with visual signals for bullish and bearish breakouts, aiding traders in timing entries. It is applicable across various markets including Forex, cryptocurrencies, stocks, and indices, with symbols like BTCUSD, EURUSD, GBPUSD, XAUUSD, NAS100, and USDJPY. The system integrates volatility compression detection with trend analysis to assist in identifying breakout trading opportunities.


