Mô tả
Chỉ báo Pinescriptlabs Store: Pinescriptlabs Store cBots : (cBot) Gold & BTC BreakoutSession Pivots(mới)
SmartTrend Support &
Resistance
Lines
Phân tích
Cấu trúc thị trường
Động
của
Điểm
Quay đầu
Fibonacci
Hồi quy tuyến tính
Đa khung thời gian
Multi-timeframe
Multi-Level
Candle Bias
Tracker
Tự động
Hỗ trợ và
Kháng cự
Xu hướng
Lines
Tất cả
Hỗ trợ và
Kháng cự
Levels
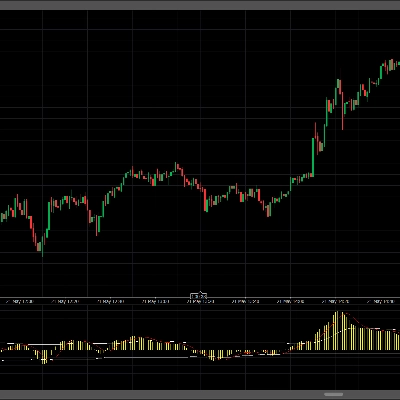
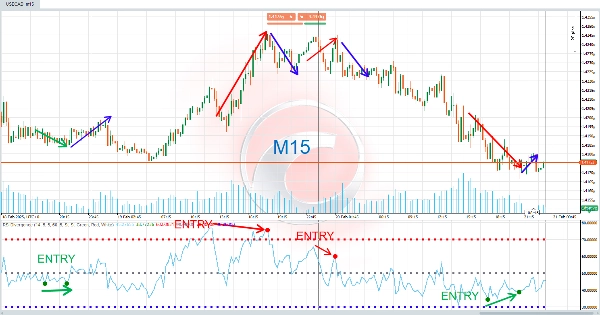
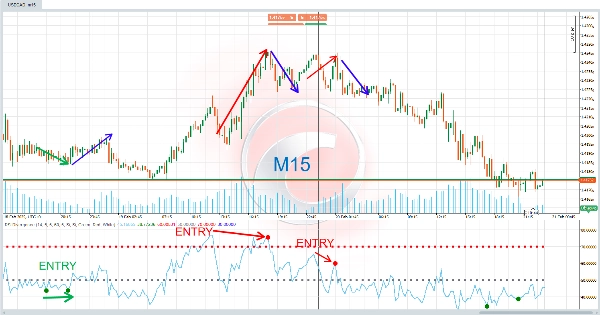
Chỉ báo RSI Divergence là một công cụ phân tích kỹ thuật tiên tiến được thiết kế để phát hiện sự phân kỳ giữa giá và Chỉ số Sức mạnh Tương đối (RSI) . Những sự phân kỳ này là tín hiệu mạnh mẽ có thể dự báo sự thay đổi hướng đi của thị trường, làm cho nó trở thành một tài nguyên vô giá cho các nhà giao dịch kỹ thuật. 🔍💡
⚙️ Nó hoạt động như thế nào?
Chỉ báo này hoạt động dựa trên nguyên tắc rằng giá và RSI không phải lúc nào cũng di chuyển đồng bộ. Khi xảy ra sự phân kỳ, điều đó có nghĩa là giá đang gửi một tín hiệu trái ngược với xu hướng RSI cơ bản. Điều này có thể là cảnh báo sớm rằng xu hướng hiện tại có thể đang mất sức mạnh.
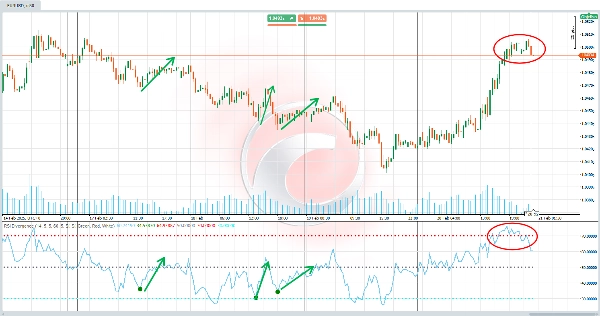
- Phân kỳ tăng (Xu hướng tăng) 📈 :
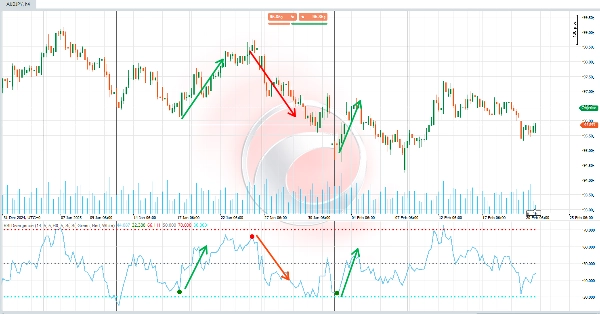
Xảy ra khi giá tạo đáy thấp hơn , nhưng RSI tạo đáy cao hơn . Điều này cho thấy mặc dù giá đang giảm, động lực tăng có thể đang gia tăng, có khả năng dẫn đến sự đảo chiều tăng. ✅ - Phân kỳ giảm (Xu hướng giảm) 📉 :
Xảy ra khi giá tạo đỉnh cao hơn , nhưng RSI tạo đỉnh thấp hơn . Điều này cho thấy mặc dù giá đang tăng, động lực giảm có thể đang gia tăng, có khả năng dẫn đến sự đảo chiều giảm. ❌
Chỉ báo tự động phát hiện những sự phân kỳ này và làm nổi bật chúng trên biểu đồ bằng màu sắc, đường kẻ và nhãn để dễ dàng diễn giải. 🎯
💡 Nó được sử dụng để làm gì?
Chỉ báo này đặc biệt hữu ích cho:
- Xác định điểm vào và ra : Sự phân kỳ có thể đóng vai trò là tín hiệu mua (tăng) hoặc bán (giảm). 🛒💸
- Dự đoán sự thay đổi xu hướng : Sự phân kỳ là tín hiệu sớm cho thấy xu hướng hiện tại có thể đang mất sức mạnh. ⚡
- Xác nhận phân tích kỹ thuật : Nó có thể được sử dụng cùng với các chỉ báo khác hoặc mô hình nến để xác thực quyết định giao dịch. 🧠📊
Nó lý tưởng cho cả nhà giao dịch trong ngày và nhà đầu tư dài hạn, vì sự phân kỳ áp dụng cho mọi khung thời gian. ⏳📈
🛠️ Cách sử dụng?
- Thiết lập ban đầu:
-
- Tùy chỉnh các tham số theo nhu cầu của bạn, chẳng hạn như chu kỳ RSI, phạm vi tìm kiếm pivot và màu sắc tín hiệu. 🎨⚙️
- Bật hoặc tắt hiển thị sự phân kỳ tăng hoặc giảm dựa trên sở thích của bạn. ✅❌
- Diễn giải tín hiệu:
-
- Phân kỳ tăng : Khi tín hiệu "D" màu xanh lá xuất hiện trên biểu đồ, nó báo hiệu một cơ hội mua tiềm năng. 🟩🛒
- Phân kỳ giảm : Khi tín hiệu "D" màu đỏ xuất hiện trên biểu đồ, nó báo hiệu một cơ hội bán tiềm năng. 🟥🚫
- Ngoài ra, các đường nối các điểm phân kỳ được vẽ để hỗ trợ phân tích trực quan. 📐🔗
- Ra quyết định:
-
- Sử dụng các tín hiệu này để điều chỉnh chiến lược của bạn, chẳng hạn như mở vị thế, đóng giao dịch hiện tại hoặc điều chỉnh mức dừng lỗ. 🤝💼
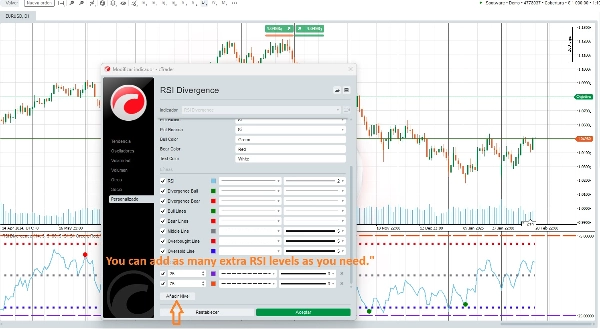
🆕 Tùy chỉnh nâng cao!
🌟 Bạn có thể thêm bao nhiêu mức RSI tùy ý người dùng 🌟
Chỉ báo này cho phép bạn tùy chỉnh hoàn toàn trải nghiệm giao dịch của mình. Bạn có thể thêm nhiều mức RSI để thích ứng với các chiến lược và phong cách giao dịch khác nhau. Ví dụ, bạn có thể cấu hình thêm các mức quá mua và quá bán hoặc thậm chí điều chỉnh chu kỳ RSI để phù hợp với các khung thời gian khác nhau. 🔄📈📉
Tóm tắt
Designed for use on any timeframe, the indicator helps traders identify entry and exit points, anticipate trend changes, and confirm other technical analysis signals. Users can customize parameters such as RSI period, pivot search ranges, signal colors, and enable or disable specific divergence types. Additionally, multiple RSI levels can be added to tailor the indicator to various trading strategies and styles.
This tool is suitable for intraday traders and long-term investors across markets including cryptocurrencies (e.g., BTCUSD), commodities (e.g., gold, XAUUSD), and indices. It supports enhanced decision-making by providing early warnings of trend strength shifts based on RSI divergence analysis.
Đánh giá của khách hàng
5 | 0 % | |
4 | 100 % | |
3 | 0 % | |
2 | 0 % | |
1 | 0 % |