
Opis
🔧 ATR_RR_SignalPanel — Opis techniczny i szczegółowy (EN) 🧠📈
ATR_RR_SignalPanel to nakładkowy wskaźnik dla cTrader, który generuje sygnały wejścia zmiany trendu wykorzystując reżim Szybkiej EMA kontra Wolna EMA, a następnie buduje kompletny wirtualny system transakcyjny (Wejście 🏁, Stop Loss 🛑, Końcowy Take Profit 🎯, Pośrednie cele 🟢) wykorzystując rozmiar ryzyka oparty na ATR oraz konfigurowalny współczynnik Ryzyko:Zysk ⚖️.
🧭 Główna logika (Silnik sygnału) 🚦
- Wskaźnik oblicza:
-
- Szybką EMA ⚡ oraz Wolną EMA 🐢 na zamknięciu.
- ATR (wygładzanie Wildera) 🌡️ dla odległości stopu opartej na zmienności.
- Definiowany jest reżim trendu jako:
-
- Trend byka 🟢 gdy
Szybka EMA > Wolna EMA - Trend niedźwiedzia 🔴 gdy
Szybka EMA < Wolna EMA
- Trend byka 🟢 gdy
- Zmiana trendu 🔁 następuje, gdy stan byka/niedźwiedzia różni się od poprzedniego słupka (odpowiednik Pine’a
bullTrend != bullTrend[1]).
🎯 Warunki wejścia (KUP/SPRZEDAJ) 🟩🟥
Gdy następuje zmiana trendu:
- Sygnał KUP 🟢 jeśli:
-
- Aktywny jest trend byka i wykryto zmianę trendu
- Opcjonalne potwierdzenie świecy ✅: Zamknięcie > Otwarcie (świeca wzrostowa)
- Sygnał SPRZEDAJ 🔴 jeśli:
-
- Aktywny jest trend niedźwiedzia i wykryto zmianę trendu
- Opcjonalne potwierdzenie świecy ✅: Zamknięcie < Otwarcie (świeca spadkowa)
🧪 Wirtualne zarządzanie pozycją (nie cBot) 🧩
Ten wskaźnik nie składa zleceń. Zamiast tego symuluje wewnętrzną „wirtualną pozycję”:
- Na nowym sygnale KUP/SPRZEDAJ ustawia:
-
- Cenę wejścia = bieżące zamknięcie 🏁
- Stop Loss = ekstremum świecy ± ATR × mnożnik 🛑
- Końcowy Take Profit = Wejście ± (Ryzyko × RyzykoZysk) 🎯
- Poziomy pośredniego TP = kroki na 1R, 2R, … do floor(RR)-1 🟢
- Monitoruje ruch cenowy słupek po słupku:
-
- Jeśli końcowy TP zostanie dotknięty ➜ oznacza 🎯 i zamyka wirtualną pozycję ✅
- Jeśli SL zostanie dotknięty ➜ oznacza 🛑 i zamyka wirtualną pozycję ❌
- Pośrednie trafienia TP są śledzone tylko raz 🧷
🔁 Logika unieważniania (przeciwny sygnał podczas aktywności) ⚠️
Jeśli pojawi się nowy sygnał, gdy istnieje wirtualna transakcja w przeciwnym kierunku:
- Poprzednie wejście jest oznaczone jako UNIEWAŻNIONE ⚠️ (INV KUP / INV SPRZEDAJ)
- Poprzednia wirtualna pozycja jest zakończona 🧯
- Tworzona jest nowa wirtualna pozycja w nowym kierunku 🔄
🧼 Bezpieczne wieloinstancyjne działanie (wiele kopii na tym samym wykresie) 🧩🧩
Każda instancja wskaźnika generuje unikalne wewnętrzne ID 🆔, więc:
- Linie/teksty z jednej instancji nie nadpiszą innej instancji ✅
- Możesz uruchomić kilka konfiguracji równolegle (np. skalping + swing) 🧠📊
🧯 Kontrola przeciwdziałająca zaśmiecaniu (limitator znaczników) 🧹✨
Aby utrzymać czytelność wykresów, może:
- Ograniczyć liczbę rysowanych znaczników tekstowych (KUP/SPRZEDAJ/TP/SL/INV/TP1…) 🧾
- Automatycznie usuwać starsze znaczniki, gdy limit zostanie przekroczony ♻️
🧷 Opcjonalne „Zachowaj ostatnie linie ryzyka” 🧠📌
Po włączeniu ostatnie linie Wejścia/SL/TP pozostają widoczne nawet po zamknięciu TP/SL:
- Świetne do przeglądu po transakcji 🧑🔬
- Świetne do prowadzenia dziennika 📒✅
⚙️ Parametry — Szczegółowe wyjaśnienie (EN) 🔍📌
📈 Rdzeń sygnału i ryzyka
⚡ Szybka EMA
- Co robi 🧠: Ustawia okres szybkiej EMA używanej do wykrywania zmian reżimu.
- Efekt 📊: Niższe wartości = bardziej reaktywne ➜ więcej sygnałów; wyższe = gładsze ➜ mniej sygnałów.
- Typowe zakresy 🎛️: 3–10 dla szybkich rynków ⚡, 10–20 dla spokojniejszych ustawień 🐢
🐢 Wolna EMA
- Co robi 🧠: Ustawia okres wolnej EMA używanej jako baza trendu.
- Efekt 📊: Wyższa wolna EMA = silniejsze filtrowanie ➜ mniej wyzwalaczy zmiany trendu.
- Typowe zakresy 🎛️: 13–55 w zależności od stylu 🧭
🌡️ Okres ATR
- Co robi 🧠: Kontroluje długość pomiaru zmienności dla ATR.
- Efekt 📏: Krótki ATR reaguje szybko (ciaśniejszy SL), długi ATR stabilizuje (bardziej stały SL).
- Typowe zakresy 🎛️: 10–21 jest powszechne ✅
🛑 Mnożnik SL (ATR)
- Co robi 🧠: Definiuje odległość Stop Loss w jednostkach ATR.
- Long 🟢:
SL = Low - ATR * Mult - Short 🔴:
SL = High + ATR * Mult - Efekt 🎯: Wyższy mnożnik = szerszy SL (mniej stopów, większe ryzyko); niższy = ciaśniejszy SL (więcej stopów).
- Typowe wartości 🎛️: 0.3–2.0 w zależności od zmienności 🌪️
⚖️ Ryzyko:Zysk (R:R)
- Co robi 🧠: Mnoży odległość „ryzyka” do obliczenia końcowego TP.
- Wzór 📌:
-
- Ryzyko = |Wejście − SL|
- Końcowy TP = Wejście ± Ryzyko × RR 🎯
- Pośrednie TP 🟢: TP1 na 1R, TP2 na 2R, … do
floor(RR)-1 - Przykład 🧪: RR=3 ➜ TP1 (1R), TP2 (2R), Końcowy TP (3R) 🎯🎯🎯
✅ Wymagaj potwierdzenia świecą
- Co robi 🧠: Dodaje walidację kierunku świecy na słupku sygnału.
- KUP 🟢: wymaga Zamknięcia > Otwarcia
- SPRZEDAJ 🔴: wymaga Zamknięcia < Otwarcia
- Efekt 🧽: Filtruje słabe odwrócenia, redukuje szumy, może wejść później ⏳
📌 Wyświetlanie EMA
👁️ Pokaż szybką EMA
- Co robi 🧠: Pokazuje/ukrywa linię szybkiej EMA.
- Zastosowanie 💡: Ukryj, jeśli chcesz czysty wykres 🧼
👁️ Pokaż wolną EMA
- Co robi 🧠: Pokazuje/ukrywa linię wolnej EMA.
- Zastosowanie 💡: Zachowaj widoczną dla kontekstu trendu 🧭
🎛️ Kontrole wizualne (zarządzanie zaśmieceniem) 🧹✨
🚦 Pokaż sygnały
- Co robi 🧠: Pokazuje/ukrywa znaczniki KUP/SPRZEDAJ.
- Zawiera 🧷: znaczniki KUP 🟢 / SPRZEDAJ 🔴 (tylko)
- Wskazówka 💡: Wyłącz, aby mieć tryb „tylko linie” 📏
🏷️ Pokaż etykiety TP
- Co robi 🧠: Pokazuje/ukrywa etykiety takie jak TP1, TP2…
- Efekt 🧼: Wyłączenie usuwa dużo szumu tekstowego na wyższych TF 📉
- Uwaga 🧷: Etykiety pojawiają się tylko raz na trafienie TP ✅
⚠️ Pokaż oznaczenia unieważnienia
- Co robi 🧠: Pokazuje/ukrywa znaczniki INV KUP / INV SPRZEDAJ.
- Zastosowanie 🧠: Przydatne, gdy chcesz badać odwrócenia sygnałów 🔁
🎯🛑 Pokaż końcowe oznaczenia TP/SL
- Co robi 🧠: Pokazuje/ukrywa końcowe znaczniki TP i SL.
- Zastosowanie 📒: Świetne do przeglądu rozkładu wyników 🎲
📏 Pokaż linie ryzyka (Wejście/SL/TP)
- Co robi 🧠: Rysuje linie Wejścia 🏁, SL 🛑, Końcowego TP 🎯 na wykresie.
- Efekt 📌: Wizualizuje strukturę wirtualnej transakcji natychmiast 🧠
🟢 Pokaż pośrednie linie TP
- Co robi 🧠: Rysuje przerywane linie dla poziomów TP1/TP2/…
- Wskazówka 🧼: Wyłącz, jeśli wykres robi się zbyt „zielonym spaghetti” 🍝🟢
📌 Zachowaj ostatnie linie ryzyka
- Co robi 🧠: Utrzymuje widoczne ostatnie linie Wejścia/SL/TP po wirtualnym wyjściu (TP/SL).
- Dlaczego to przydatne 📒: Idealne do prowadzenia dziennika i analizy po transakcji 🧑🔬✅
🧾 Maksymalna liczba znaczników na wykresie (0=bez limitu)
- Co robi 🧠: Ogranicza liczbę obiektów tekstowych pozostawianych przez wskaźnik na wykresie.
- Jak działa ♻️: Gdy limit zostanie przekroczony, najstarsze znaczniki są usuwane automatycznie.
- Zalecane 🎛️: 80–200 w zależności od interwału czasowego i głębokości historii 🕰️
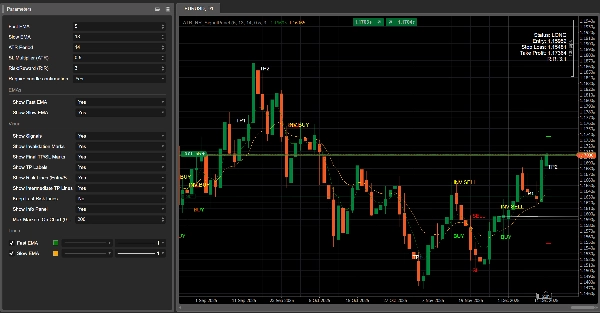
🧾 Pokaż panel informacyjny
- Co robi 🧠: Wyświetla kompaktowy panel statusu na wykresie.
- Pokazuje 📋: Status (LONG/SHORT/Brak pozycji), Wejście, SL, TP, obliczony RR.
Podsumowanie
The indicator simulates virtual trades by setting entry price, stop loss, and take profit levels using Average True Range (ATR) for volatility-based risk sizing combined with a configurable risk-to-reward multiplier. It tracks intermediate take profit levels and monitors price action bar-by-bar to mark virtual trade outcomes without placing actual orders.
Key features include optional candle confirmation for signals, multi-instance support to run multiple configurations on the same chart, and visual clutter controls such as limiting markers and toggling display of EMAs, signals, and risk lines. An info panel provides a compact status overview of virtual positions. Parameters allow customization of EMA periods, ATR period, stop loss multiplier, and risk-reward ratio to adapt to different trading styles and market conditions.
Supported markets include Forex, indices, commodities, stocks, and cryptocurrencies, with symbols like GBPUSD, EURUSD, XAUUSD, NAS100, and BTCUSD among the tagged assets.
Opinie klientów
5 | 100 % | |
4 | 0 % | |
3 | 0 % | |
2 | 0 % | |
1 | 0 % |


