

Descrizione
Chi è coinvolto nel trading sa quanto sia importante tenere conto della sessione precedente.
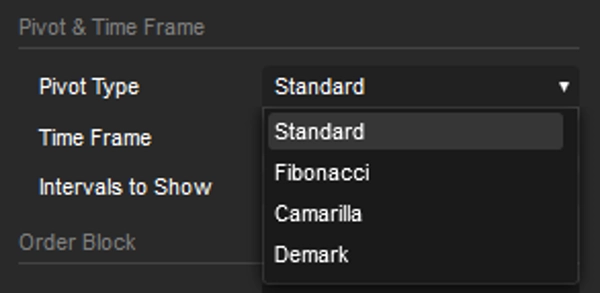
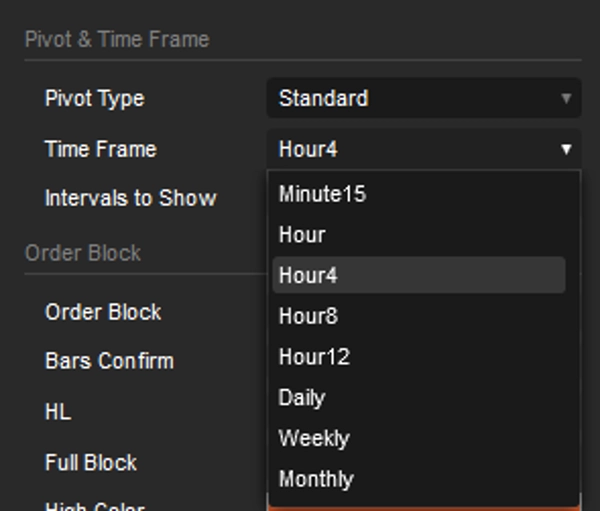
Ho preparato questo indicatore Pivot, con intervalli da 15 minuti fino a un mese, e include blocchi d'ordine e linee di tendenza. Entrambe le opzioni si basano sui punti più alti e più bassi della sessione precedente.
La configurazione predefinita è impostata per un intervallo temporale di 5 minuti.
Il pivot è impostato a 4 ore, e l'intervallo è 5, il che significa che guarda indietro di 20 ore in intervalli di 4 ore. Questo è perfetto per chi fa trading giornaliero.
Tuttavia, se sei un fan dello Swing Trading, devi solo cambiare l'intervallo del Pivot; tutto il resto si adatta automaticamente.
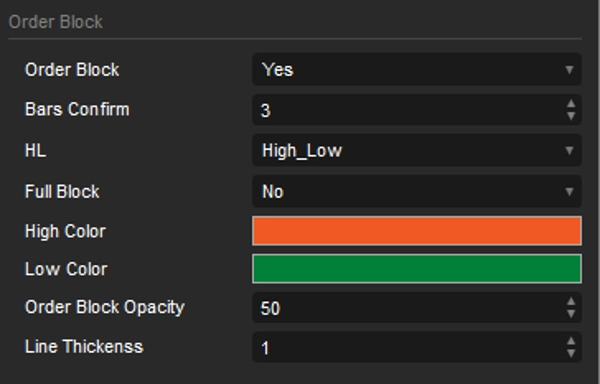
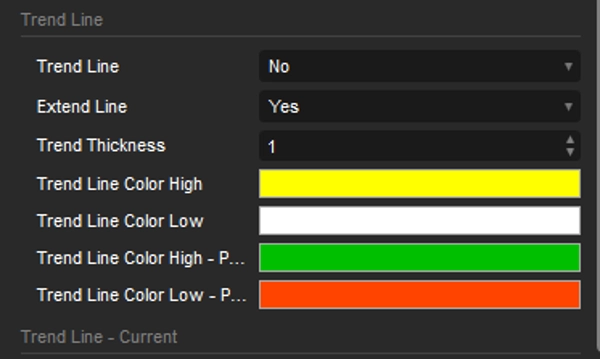
I blocchi d'ordine evidenziano potenziali aree in cui il prezzo potrebbe trovare supporto o resistenza, offrendo indicazioni su possibili inversioni o continuazioni. Combinandoli con le linee di tendenza generate automaticamente per l'intervallo temporale scelto, i trader possono identificare con maggiore precisione la direzione potenziale del prezzo e i possibili punti di ingresso o uscita. La capacità di visualizzare queste linee di tendenza su più intervalli temporali fornisce una comprensione più completa della struttura del mercato.
Con strumenti aggiuntivi come
OrderPrice V3 https://ctrader.com/products/397
NTMPICLL https://ctrader.com/products/327
Range Box Level https://ctrader.com/products/245
Or RangeBoxFibonacci https://ctrader.com/products/526
Market Session https://ctrader.com/products/94
MacdVolume https://ctrader.com/products/267
4MA https://ctrader.com/products/247
Sarai invincibile
Buona fortuna 😀
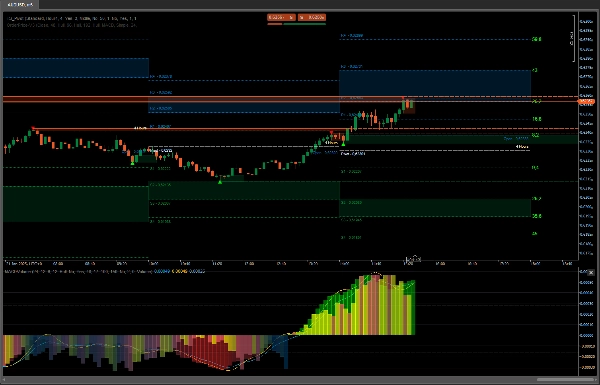
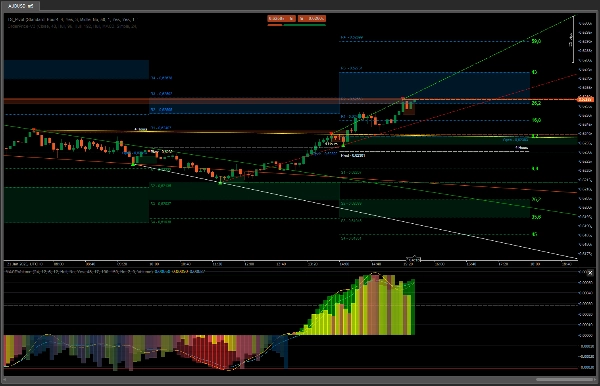
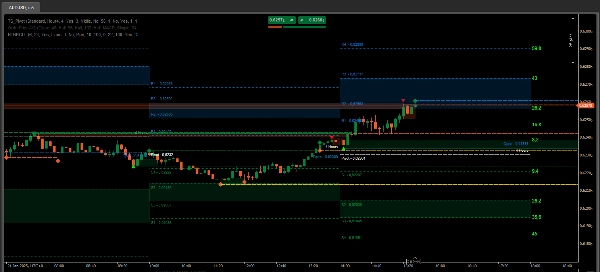
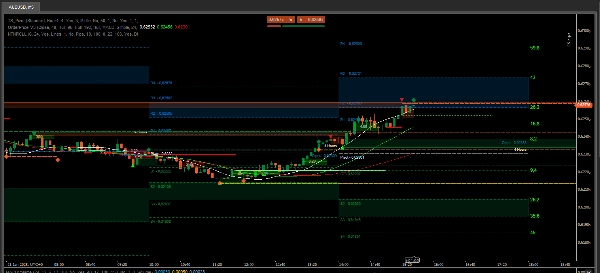
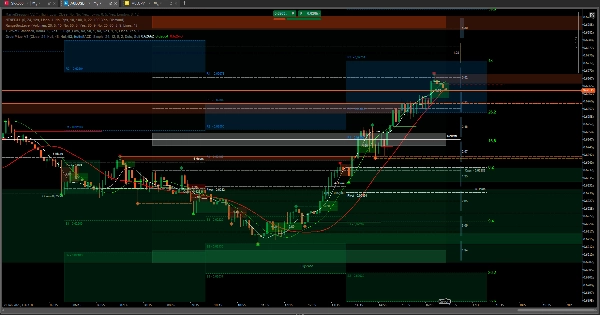
Nel caso di un acquisto, osservando le ultime due immagini il comportamento di OrderPrice e delle medie mobili incorporate, quando appare una linea verde e la media mobile è sotto, è il momento perfetto per aprire una transazione di acquisto.
Con i dati della sessione precedente, puoi determinare quanto lontano potrebbe andare il prezzo o dove potrebbe verificarsi una resistenza. Se viene superata, potrebbe continuare fino al secondo punto, che potrebbe essere la zona neutra di RangeBoxLevel. Se la supera e non ci sono segnali che le medie mobili vogliano cambiare direzione, il prezzo potrebbe raggiungere la zona del blocco d'ordine della sessione precedente.
Nell'ultima immagine, c'è uno screenshot di una situazione perfetta per entrare e uscire da una transazione. Il resto è solo osservare e trarre conclusioni.
Questi strumenti sono essenziali quando si tratta di vincere attraverso il trading di asset.
Riepilogo
Key features include the integration of order blocks and trend lines derived from previous session data. Order blocks identify potential support and resistance zones, aiding in spotting possible price reversals or continuations. The indicator automatically generates trend lines for the selected timeframe, helping traders assess market structure and potential price direction. Visualizing these trend lines across multiple timeframes enhances market analysis.
TS_Pivot can be used alongside complementary tools such as OrderPrice V3, NTMPICLL, Range Box Level, RangeBoxFibonacci, Market Session, MacdVolume, and 4MA to refine entry and exit decisions. By combining moving averages and order block signals, traders can identify optimal moments to open buy or sell positions. The indicator supports various markets including Forex, cryptocurrencies, commodities, indices, and stocks.
Recensioni dei clienti
5 | 100 % | |
4 | 0 % | |
3 | 0 % | |
2 | 0 % | |
1 | 0 % |


![Logo di "[Stellar Strategies] Market Session Ultimate"](https://cdn.ctrader.com/image/webp/61ffd537-0125-4246-9e72-42eca1791d64_28232)


