
Descrizione
Guida Utente WinSMC
1. Scopo
`WinSMC` è un indicatore SMC sovrapposto per cTrader. Ti aiuta a identificare visivamente:
- Cambiamenti nella struttura del mercato
- `BOS` (Break of Structure)
- `MSS` (Market Structure Shift)
- `Order Blocks`
- `Liquidity Grabs` / `Sweeps`
- `FVG` (Fair Value Gaps)
Non è un sistema di trading automatico. È uno strumento di struttura e contesto da usare al meglio per il trading basato sulla conferma.
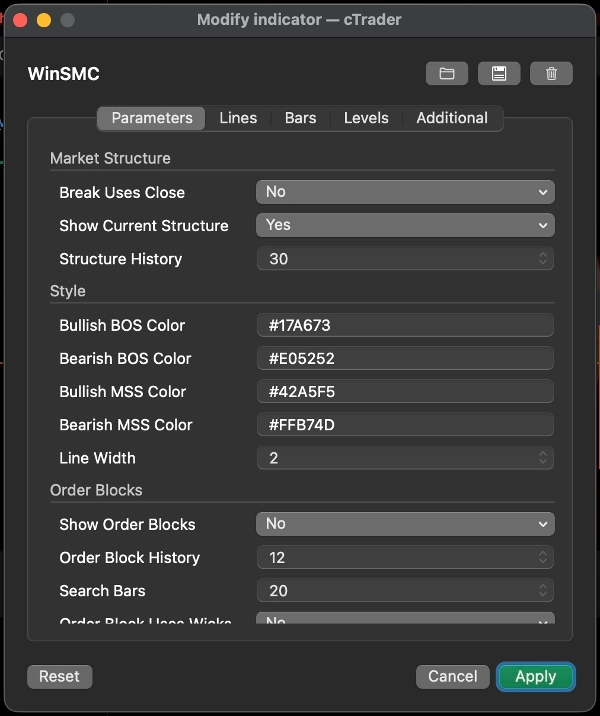
2. Concetti Fondamentali
Lunghezza dello Swing
`Swing Length` controlla quanto a sinistra e a destra un pivot deve essere confermato prima di essere considerato un punto di swing valido.
Indicazioni pratiche:
- Valori più piccoli = più segnali, più rumore
- Valori più grandi = meno segnali, struttura più pulita
Il Break Usa la Chiusura
Questa impostazione decide se una rottura di struttura è confermata da:
- `Sì`: chiusura della candela
- `No`: rottura del wicks/minimo/massimo
Indicazioni:
- Usa la chiusura per un approccio più conservativo
- Usa le rotture dei wicks per una rilevazione anticipata e più sensibile
Mostra la Struttura Corrente
Mostra le linee di swing high e swing low attive correnti, aiutandoti a vedere cosa il mercato sta ancora rispettando.
Storia della Struttura
Controlla quante linee e etichette di rottura di struttura vengono mantenute sul grafico.
3. BOS e MSS
BOS
`BOS` significa che il prezzo continua nella stessa direzione e rompe il massimo o minimo precedente.
Interpretazione tipica:
- In un trend rialzista, rompere il massimo precedente è un BOS rialzista
- In un trend ribassista, rompere il minimo precedente è un BOS ribassista
MSS
`MSS` significa che il mercato ha cambiato direzione rispetto al bias precedente.
Interpretazione tipica:
- Se il prezzo era ribassista e rompe un massimo precedente, quello è un MSS rialzista
- Se il prezzo era rialzista e rompe un minimo precedente, quello è un MSS ribassista
Uso nel trading
- `BOS` è più orientato alla continuazione del trend
- `MSS` è più orientato al ribaltamento
- Le migliori entrate solitamente derivano da un retest di un `Order Block` o `FVG`
4. Order Blocks
Un `Order Block` è l'ultima candela opposta prima di una rottura di struttura. È comunemente trattato come una zona di reazione domanda/offerta.
Mostra Order Blocks
Quando abilitato, l'indicatore guarda indietro dopo un `BOS` o `MSS` e disegna la zona dell'ultima candela opposta.
Significato
- OB rialzista: dopo una rottura rialzista, si usa l'ultima candela ribassista
- OB ribassista: dopo una rottura ribassista, si usa l'ultima candela rialzista
Quando il prezzo inizia a interagire con la zona, viene segnato come mitigato.
Order Block Usa i Wicks
Questo controlla quanto è larga la scatola disegnata:
- `Sì`: usa l'intervallo completo della candela, zona più ampia
- `No`: usa una zona centrale più stretta
Indicazioni:
- Usa `Sì` per una zona più ampia e conservativa
- Usa `No` per una zona più stretta e precisa
Strategia Order Block
Flusso di lavoro comune:
1. Aspetta `BOS` o `MSS`
2. Segna l'OB corrispondente
3. Aspetta il retest
4. Cerca conferma prima di entrare
Non considerare l'OB come un punto di inversione garantito. È un'area di alto interesse, non una certezza.
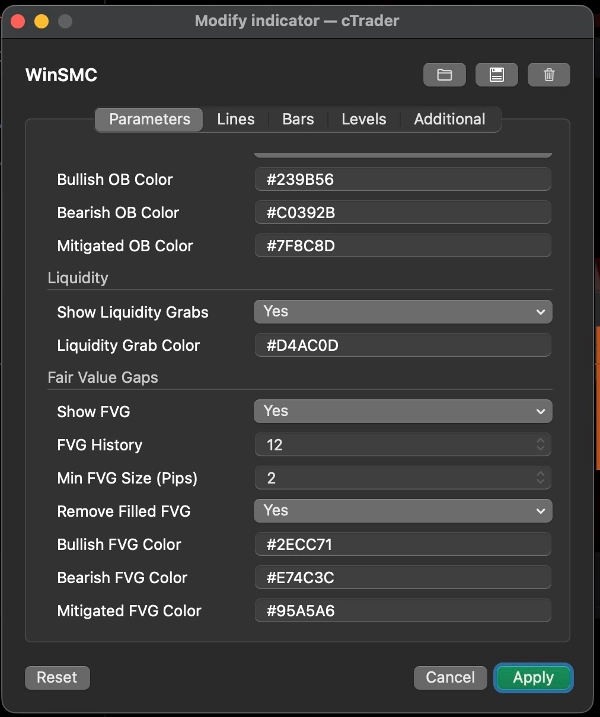
5. Liquidity Grabs / Sweeps
Un `Liquidity Grab` significa che il prezzo supera un massimo precedente o scende sotto un minimo precedente, poi chiude di nuovo all'interno.
In questo indicatore:
- `Sweep lato acquisto`: il prezzo supera il massimo precedente e chiude di nuovo sotto
- `Sweep lato vendita`: il prezzo scende sotto il minimo precedente e chiude di nuovo sopra
Questo di solito significa che il mercato ha catturato liquidità e potrebbe prepararsi per la mossa successiva.
Importante
Uno sweep da solo non è un segnale di trading.
È meglio considerarlo come:
- Un avviso che la liquidità è stata presa
- Un suggerimento per un setup
- Un motivo per aspettare `MSS` o `BOS`
Uso comune
- Dopo uno `Sweep lato acquisto`, un `MSS` ribassista può supportare un setup short
- Dopo uno `Sweep lato vendita`, un `MSS` rialzista può supportare un setup long
6. FVG
`FVG` è un Fair Value Gap creato da uno squilibrio di tre candele.
Mostra FVG
Quando abilitato, l'indicatore disegna zone FVG visibili.
Regola di rilevamento
- FVG rialzista: il massimo della prima candela è sotto il minimo della terza candela
- FVG ribassista: il minimo della prima candela è sopra il massimo della terza candela
Dimensione Minima FVG (Pips)
Filtra i gap troppo piccoli.
- Unità: `pips`
- Valore più alto = meno FVG ma più significativi
- `0` = nessun filtro di dimensione
Utile quando il grafico è affollato o quando gap minuscoli di 1 pixel non sono utili per il tuo flusso di lavoro.
Rimuovi FVG Riempiti
Quando abilitato, gli FVG completamente riempiti vengono rimossi dal grafico.
Strategia FVG
Due approcci comuni:
1. Ritracciamento del trend
- Aspetta `BOS` o `MSS`
- Aspetta che il prezzo ritracci nell'FVG
- Fai trading nella direzione della struttura
2. Entrata basata sulla conferma
- Osserva uno sweep
- Aspetta `MSS`
- Usa l'FVG come zona finale di ritracciamento
7. Stili di Trading Consigliati
Strategia A: Continuazione del Trend
Ideale quando il mercato è chiaramente in trend.
Flusso di lavoro:
1. Aspetta `BOS`
2. Segna l'OB
3. Cerca un ritracciamento in OB o FVG
4. Entra solo dopo che il prezzo reagisce
Questo è un approccio classico di seguire il trend.
Strategia B: Sweep Poi Inversione
Ideale quando il mercato è volatile e soggetto a falsi breakout.
Flusso di lavoro:
1. Rileva uno `Sweep lato acquisto` o `Sweep lato vendita`
2. Aspetta l'opposto `MSS`
3. Usa OB o FVG come zona di ritracciamento
4. Entra dopo la conferma
Questo è più forte che fare trading solo sullo sweep.
Strategia C: Confluenza Sweep + MSS + OB/FVG
Questo è uno dei modi più puliti per usare l'indicatore.
Flusso di lavoro:
1. Ottieni uno sweep
2. Ottieni un MSS
3. Aspetta il retest di OB o FVG
4. Fai trading solo quando le zone si sovrappongono
Questo riduce le entrate premature.
8. Suggerimenti Rapidi per le Impostazioni
- `Swing Length`: inizia con 5 o 7
- `Break Uses Close`: attiva per una visione più conservativa
- `Order Block Uses Wicks`: attiva per zone più ampie
- `Min FVG Size (Pips)`: inizia con 2.0 e adatta in base allo strumento
- `Structure History` / `Order Block History` / `FVG History`: regola per mantenere il grafico leggibile
9. Nota Finale
`WinSMC` è meglio usato come mappa della struttura, non come un trigger a segnale singolo.
Il flusso di lavoro più affidabile è:
- Identificare la direzione del trend
- Osservare lo sweep di liquidità
- Aspettare MSS o BOS
- Usare OB o FVG come zona di ingresso
- Entrare solo dopo conferma
Riepilogo
The indicator helps traders analyze price action by marking swing highs and lows, confirming valid swing points based on customizable swing length, and distinguishing breaks using candle closes or wick extremes. Order Blocks are displayed as supply/demand zones derived from the last opposite candle before a structure break, with options to adjust zone width. Liquidity Sweeps indicate price movements beyond prior highs or lows that close back inside, signaling potential setups rather than direct trade signals. FVG zones are identified by three-candle imbalances and can be filtered by minimum size and removed once filled.
WinSMC supports multiple trading strategies, including trend continuation after BOS, reversal setups following liquidity sweeps and MSS, and confluence-based entries combining sweeps, MSS, and retests of Order Blocks or FVGs. It is intended as a confirmation and structure mapping tool rather than an automated trading system, aiding traders in timing entries with contextual market information.

![Logo di "[CB] Pivot Points Pro"](https://cdn.ctrader.com/image/webp/43463c82-67b0-4f10-a4ba-901bba091d81_32594)

![Logo di "[Hamster-Coder] Pivot Points MTF"](https://cdn.ctrader.com/image/webp/4c143e5a-309c-40e3-a578-f04d1e133ffa_31159)


