
Açıklama
Stop Loss Pro, risk yönetimindeki belirsizliği ortadan kaldırmak için tasarlanmış güçlü ve ücretsiz bir cTrader göstergesidir. Gelişmiş piyasa yapısı analizine dayanarak, en güvenilir stop-loss seviyelerini otomatik olarak belirler ve doğrudan grafiğinizde gösterir. Bu araç sayesinde, tüccarlar her önerilen seviyenin teknik mantık, hacim dinamikleri ve volatilite filtrelerinin birleşimiyle desteklendiğini bilerek işlemlerini güvenle koruyabilirler.
Nasıl Çalışır
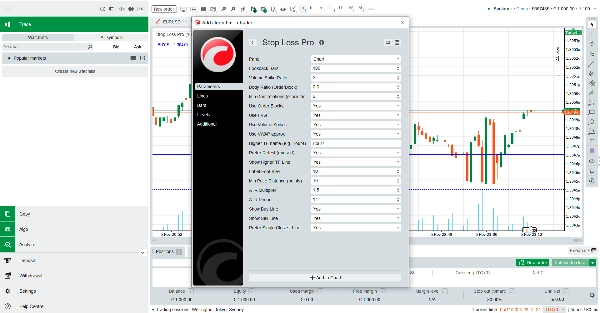
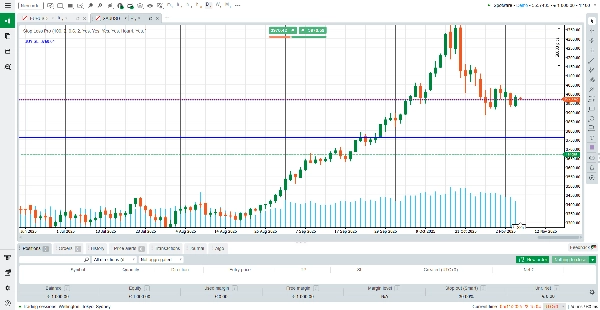
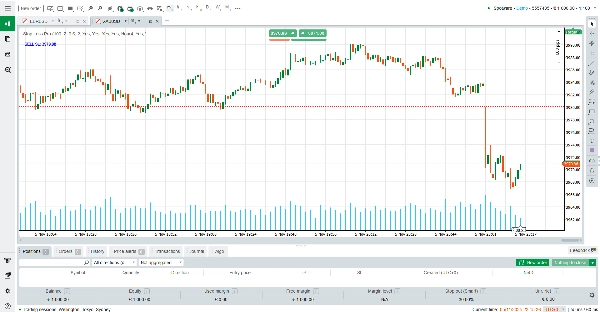
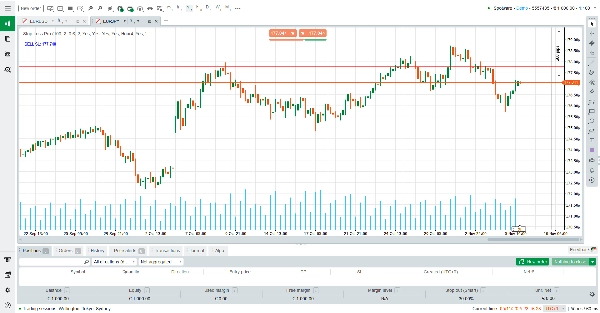
Grafiğinize eklendiğinde, Stop Loss Pro son fiyat hareketlerini, hacim artışlarını, emir bloğu oluşumlarını, adil değer boşluklarını ve volatilite aralıklarını sürekli tarar. Bu analizden, hem alım hem de satım senaryoları için en stratejik stop-loss seviyelerini hesaplar.
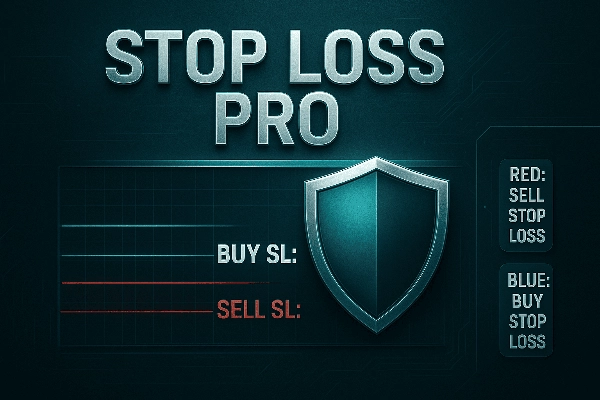
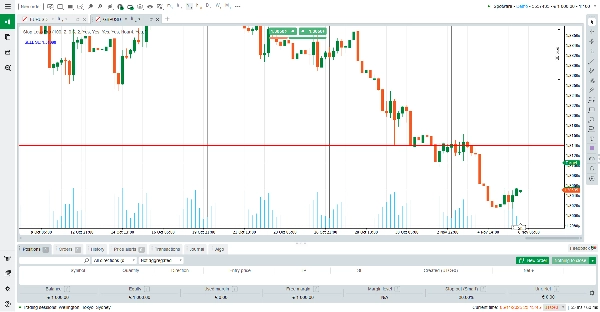
Mavi çizgi, alım işlemleri için önerilen stop-loss seviyesini temsil eder. Bu çizgi her zaman mevcut piyasa fiyatının altında, güvenlik ile verimlilik arasında denge kuran bir mesafede yer alır.
Kırmızı çizgi, satım işlemleri için önerilen stop-loss seviyesini temsil eder. Bu çizgi her zaman mevcut piyasa fiyatının üzerinde yer alır ve kısa pozisyonların ani dönüşlere karşı korunmasını sağlar.
Ayarlarınıza bağlı olarak, gösterge her iki çizgiyi aynı anda gösterebilir veya sadece en yakın ve en ilgili tek seviyeye odaklanabilir. Bu esneklik, tüccarların aracı kişisel tarzlarına uyarlamasına olanak tanır—ister muhafazakar çift çizgi onayı ister sade ve net tek çizgi tercih edin.
Bilgiyi Okuma
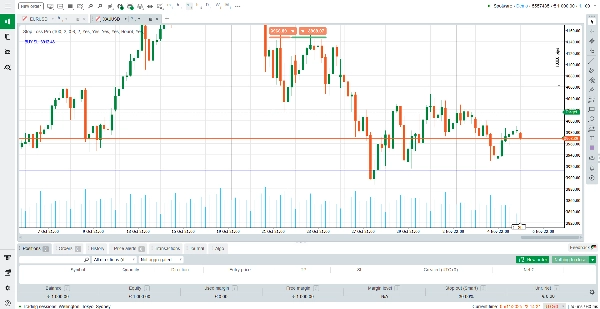
Grafiğinizin sol üst köşesinde, Stop Loss Pro aktif stop-loss önerisini açık bir etiketle gösterir. Örneğin:
“BUY SL: 1.2345” göstergenin uzun pozisyonlar için 1.2345 seviyesinde güçlü bir koruyucu seviye belirlediği anlamına gelir.
“SELL SL: 1.2450” göstergenin kısa pozisyonlar için 1.2450 seviyesinde bir stop-loss yerleştirilmesini önerdiği anlamına gelir.
Her iki sinyal de geçerliyse, gösterge mevcut piyasa fiyatına en yakın olanı vurgular ve hızlı ve kararlı hareket etmenize yardımcı olur.
Neden Önemlidir
Stop-loss yerleştirme, ticaretin en kritik yönlerinden biridir. Çok yakınsa, gürültü nedeniyle durdurulma riski vardır. Çok uzaksa, gereksiz kayıplara maruz kalırsınız. Stop Loss Pro, ATR volatilite filtreleri, emir bloğu tespiti, hacim analizi ve VWAP yaklaşık hesaplaması gibi birden fazla onay yöntemini birleştirerek hem gerçekçi hem de koruyucu seviyeler sunar.
Ana Özellikler
Çift Stop-Loss Çizgileri – Hem alım hem satım koruyucu seviyelerini anında görün, netlik için renk kodlu.
Akıllı Filtreleme – ATR, hacim artışları ve emir bloğu mantığını kullanarak zayıf veya rastgele seviyelerden kaçınır.
Yüksek Zaman Dilimi Farkındalığı – İsteğe bağlı olarak, ek güven için daha büyük zaman dilimlerinden onay çizgilerini gösterir.
Esnek Görüntüleme Modları – Hem çizgileri gösterme hem de sadece piyasaya en yakın tek seviyeyi gösterme arasında seçim yapın.
Ücretsiz ve Kullanımı Kolay – Gizli maliyet yok, karmaşıklık yok—sadece grafiğinize ekleyin ve güvenle işlem yapın.
Son Söz
Stop Loss Pro sadece bir gösterge değil—riskinizi hassasiyetle yönetmenize yardımcı olan bir ticaret arkadaşıdır. İster stop-loss yerleştirmenin önemini öğrenen bir acemi olun, ister güvenilir bir onay aracı arayan deneyimli bir tüccar olun, bu gösterge netlik, disiplin ve huzur sunar. Ve en iyisi, tamamen ücretsiz indirip kullanabilirsiniz.
Bugün risk yönetiminizi Stop Loss Pro ile kontrol altına alın.
Özet
The tool integrates multiple technical factors such as Average True Range (ATR) volatility filters, volume dynamics, order block detection, and VWAP approximations to provide stop-loss levels that balance protection and efficiency. It also offers optional higher-timeframe confirmations for added reliability. A clear label on the chart indicates the active stop-loss recommendation, aiding quick decision-making.
Stop Loss Professional supports various markets including Forex, indices, commodities, cryptocurrencies, and stocks. It is suitable for different trading styles and strategies such as breakout and scalping. The indicator aims to enhance trade protection by reducing the risk of premature stop-outs or excessive losses through informed stop-loss placement.


