
Opis
Wskaźnik Candle Pressure Index (CPI) to potężne, a jednocześnie łatwe w użyciu narzędzie zaprojektowane, aby ujawnić ukrytą presję kupna i sprzedaży za każdą świecą. Zamiast jedynie pokazywać, czy cena wzrosła czy spadła, CPI zagłębia się w to, jak silnie kupujący lub sprzedający kontrolowali rynek w obrębie każdej świecy. Czyni to z niego unikalne narzędzie do identyfikacji siły trendu, wczesnego wykrywania odwróceń oraz potwierdzania punktów wejścia lub wyjścia z większą dokładnością.
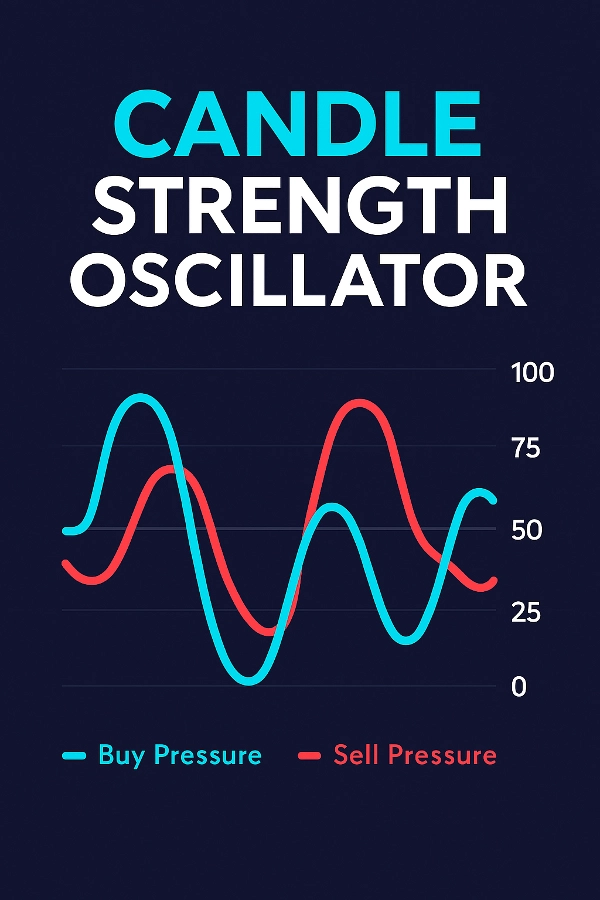
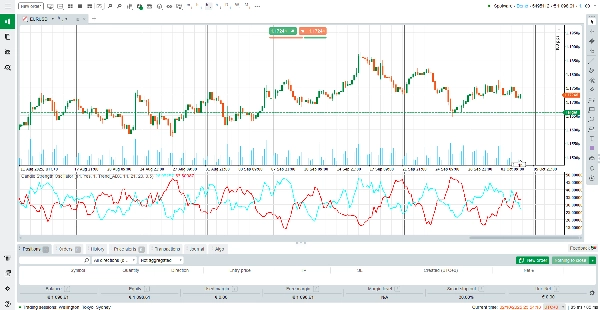
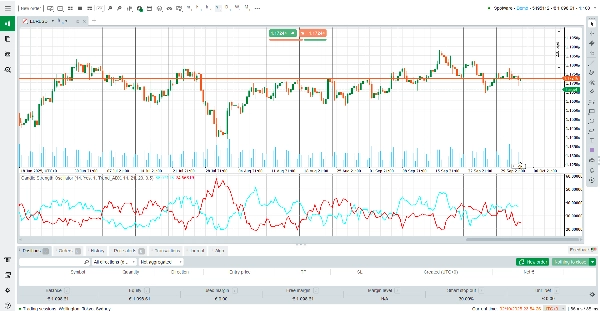
W przeciwieństwie do tradycyjnych oscylatorów, które reagują tylko na cenę, CPI łączy dynamikę korpusu świecy, momentum, ważenie wolumenu oraz analizę trendu (ADX lub EMA), aby dać Ci kompleksowy obraz presji rynkowej. Dzięki dwóm wygładzonym liniom – Presja Kupna (cyjan) i Presja Sprzedaży (czerwona) – traderzy mogą natychmiast zobaczyć, która strona rynku ma kontrolę.
Jak czytać wskaźnik
Presja Kupna (linia cyjanowa) – Reprezentuje intensywność kontroli byków. Rosnąca linia wskazuje na rosnącą dominację kupujących.
Presja Sprzedaży (linia czerwona) – Reprezentuje intensywność kontroli niedźwiedzi. Rosnąca linia wskazuje na silniejszą siłę sprzedaży.
Przecięcia – Gdy linia Kupna przecina linię Sprzedaży od dołu, sygnalizuje silniejszą presję byków (potencjalna okazja do kupna). Gdy linia Sprzedaży przecina linię Kupna, dominuje presja niedźwiedzi (potencjalna okazja do sprzedaży).
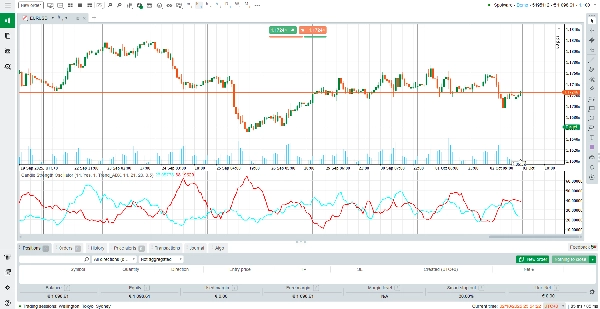
Strefa poziomu 50 – Odczyty wokół środka (≈50) wskazują na równowagę między kupującymi a sprzedającymi, podczas gdy skrajne odczyty (powyżej 75 lub poniżej 25) pokazują silną presję kierunkową.
Wzmocnienie czynnika trendu – Wskaźnik dostosowuje swoje sygnały na podstawie potwierdzenia trendu z ADX lub nachylenia EMA, redukując fałszywe sygnały podczas rynków bocznych.
Jak działa wskaźnik
CPI oblicza presję, używając modelu ważonego, który uwzględnia:
Strukturę świecy: rozmiar korpusu i pozycję zamknięcia względem maksimum/minimum.
Momentum: ruch ceny w porównaniu do poprzedniej świecy.
Wolumen: ważenie wolumenu tickowego zapewnia, że ruchy o dużym wolumenie mają większe znaczenie.
Potwierdzenie trendu: siła ADX lub nachylenie EMA dodają współczynnik wzmocnienia, aby dopasować sygnały do panującego trendu.
Wygładzanie: filtr SMA definiowany przez użytkownika zapewnia gładkie i stabilne linie bez utraty reaktywności.
Ta zaawansowana formuła oznacza, że CPI nie tylko reaguje na cenę, ale także rozumie, dlaczego cena się porusza – dając traderom głębszy wgląd w zachowanie rynku.
Kluczowe cechy
Wizualizacja dwuliniowa – Natychmiastowe porównanie presji kupna i sprzedaży za pomocą kolorowych linii (cyjan dla kupujących, czerwony dla sprzedających).
Adaptacyjne wzmocnienie trendu – Integruje ADX lub EMA, aby potwierdzić kierunek trendu i zmniejszyć fałszywe sygnały.
Obliczenia uwzględniające wolumen – Ważone wolumenem tickowym, aby podkreślić ruchy poparte rzeczywistym udziałem rynku.
Wygładzony i czysty wyświetlacz – Wbudowany filtr SMA zapewnia gładkie odczyty bez opóźnień i zniekształceń.
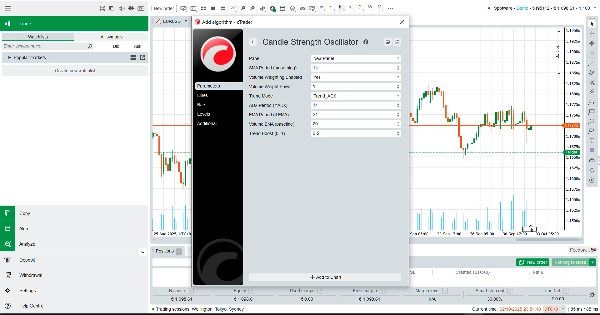
W pełni konfigurowalny – Regulowane okresy, ważenie i intensywność wzmocnienia, aby dopasować do każdego stylu handlu.
Dlaczego warto używać Candle Pressure Index?
CPI jest idealny dla traderów, którzy chcą wyjść poza prostą akcję cenową i zobaczyć prawdziwą walkę między kupującymi a sprzedającymi. Niezależnie od tego, czy jesteś skalperem, traderem swingowym czy podążającym za trendem, ten darmowy wskaźnik daje Ci jasność potrzebną do precyzyjnego wyznaczania wejść, zarządzania ryzykiem i pozostawania zgodnym z rzeczywistym kierunkiem rynku.
Pobierz Candle Pressure Index (CPI) już dziś – i handluj z pewnością, rozumiejąc ukryte siły napędzające każdą świecę.
Podsumowanie
The indicator displays two smooth lines: Buy Pressure (cyan) and Sell Pressure (red). Crossovers between these lines signal shifts in market dominance, helping traders identify trend strength, potential reversals, and optimal entry or exit points. Readings near the midpoint indicate balance, while extremes suggest strong directional pressure.
CPI incorporates volume-weighted calculations and trend-based boosts to reduce false signals during sideways markets. It includes a smoothing filter for stable, responsive readings and offers customization of periods, weighting, and trend boost intensity.
This tool is applicable across various markets including Forex, commodities, stocks, and cryptocurrencies, supporting trading strategies such as scalping and breakout trading. It aims to provide traders with enhanced insight into market dynamics beyond simple price action.
Opinie klientów
5 | 0 % | |
4 | 100 % | |
3 | 0 % | |
2 | 0 % | |
1 | 0 % |


