
Opis
CVD ai
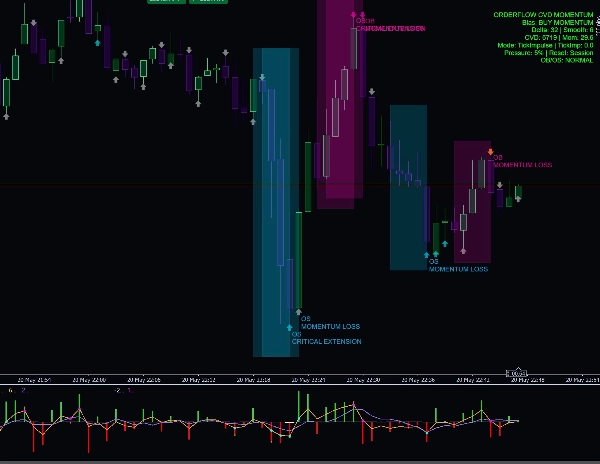
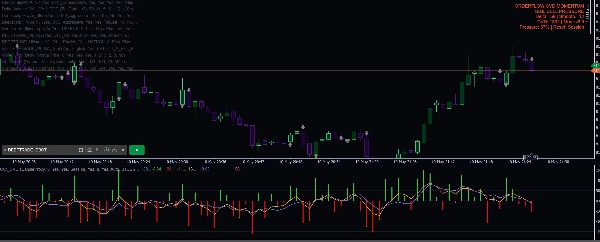
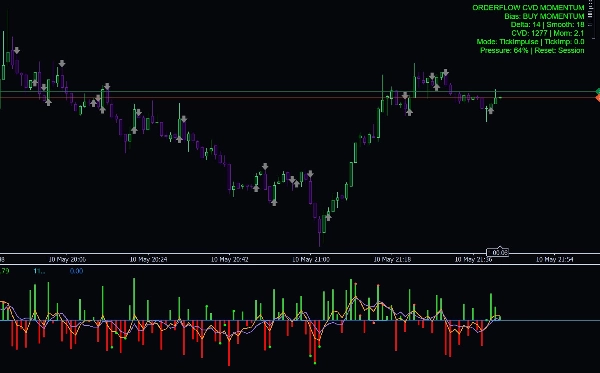
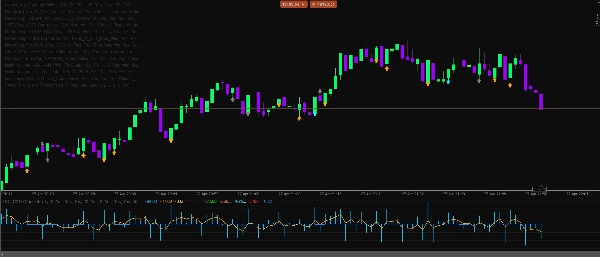
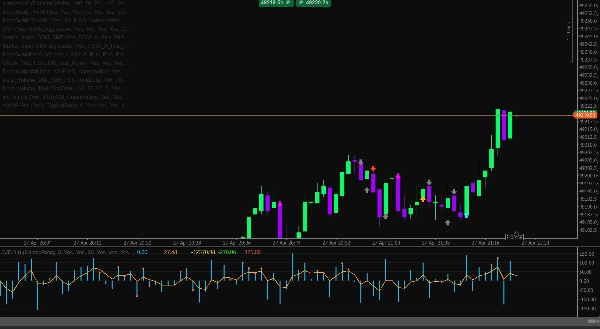
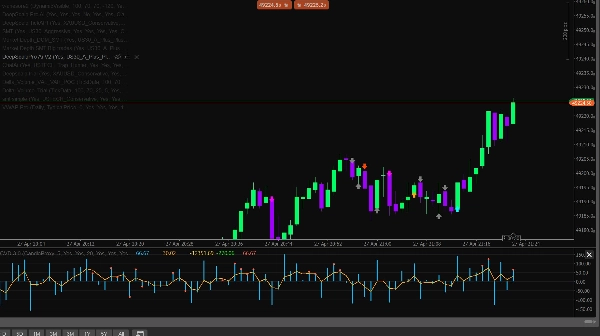
Delta CVD Advanced to profesjonalny wskaźnik analizy momentum i zleceń, zaprojektowany dla traderów, którzy chcą mieć jaśniejszy obraz presji kupna i sprzedaży bezpośrednio z zachowania rynku. Łączy Delta, CVD, momentum ticków na żywo, absorpcję, dywergencję, filtry sesji, zabezpieczenia przed zmiennością oraz inteligentny silnik konfluencji w jedno czyste narzędzie analityczne.
Ten wskaźnik jest stworzony do skalpowania, handlu intraday oraz potwierdzania krótkoterminowego momentum na rynkach Forex, Złota, Indeksów, Kryptowalut i Ropy.
Kluczowe cechy
- Obliczanie Delta na żywo za pomocą logiki uptick/downtick
- Tryb proxy delta świecy do analizy historycznej
- Linia skumulowanego wolumenu Delta do śledzenia presji w czasie
- Wygładzona linia Delta dla czystszego odczytu momentum
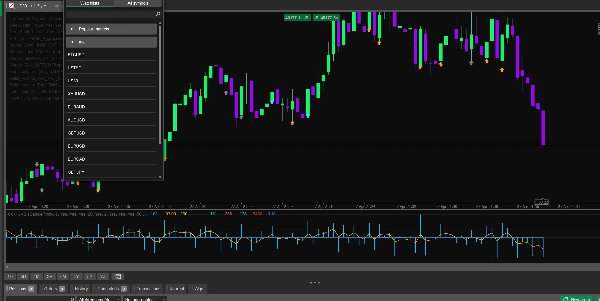
- Kolorowany histogram Delta kupna/sprzedaży
- Obliczanie momentum na podstawie ticków dla impulsu rynku na żywo
- Tryb hybrydowego momentum łączący nachylenie CVD i impuls ticków
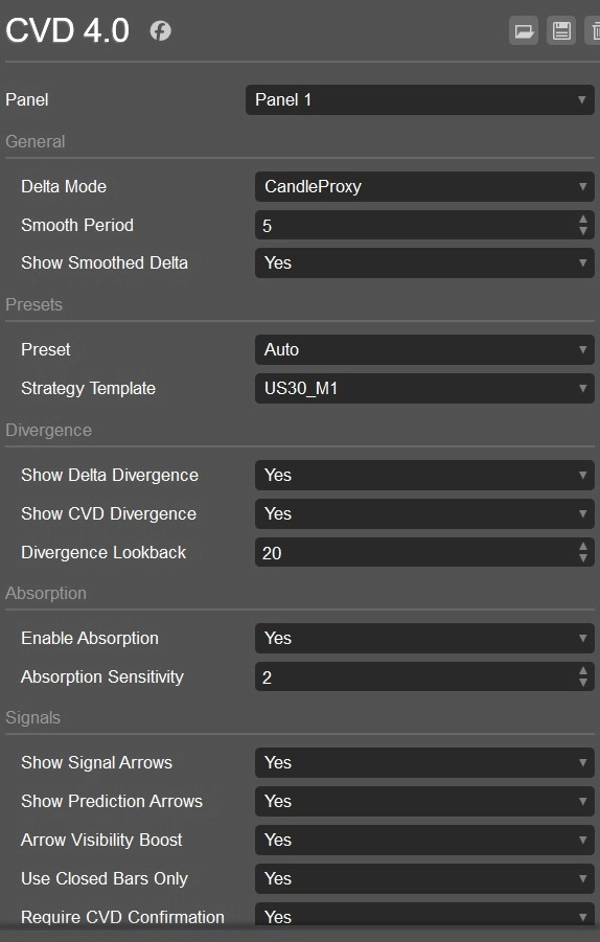
- Opcje resetowania CVD: Nigdy, Codziennie lub według sesji
- Wykrywanie byczej i niedźwiedziej dywergencji Delta
- Wykrywanie byczej i niedźwiedziej dywergencji CVD
- Wykrywanie absorpcji do identyfikacji presji, która nie przesuwa ceny
- Strzałki sygnałowe dla okazji KUPNA i SPRZEDAŻY
- Strzałki predykcyjne dla wczesnych ostrzeżeń o zmianie momentum
- Opcjonalne potwierdzenie CVD dla sygnałów
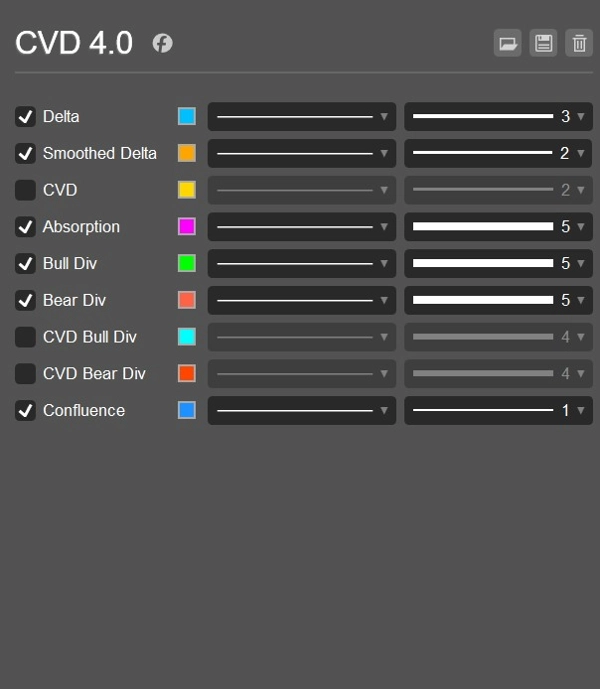
- Inteligentny silnik konfluencji z oceną kierunkową
- Filtr presji proxy DOM
- Filtr wykrywania zmiatania dla chwytania płynności
- Filtry sesji dla Azji, Londynu i Nowego Jorku
- Automatyczne wykrywanie sesji za pomocą czasu UTC
- Zabezpieczenie przed zmiennością wykorzystujące limity ATR
- Zabezpieczenie spreadu, aby unikać złych warunków rynkowych
- Filtr stosunku wolumenu, aby unikać słabych sygnałów o niskim wolumenie
- Presety symboli dla Forex, Złota, Indeksów, Kryptowalut i Ropy
- Szablony strategii dla US30 M1, USTECH M1, XAUUSD M1, BTCUSD M1 i Oil M1
- Panel informacyjny pokazujący bias, Delta, wygładzoną Deltę, CVD, Momentum, procent presji i tryb resetowania
- Opcjonalne alerty logów z kontrolą czasu odnowienia
Dlaczego traderzy go używają
Delta CVD Advanced pomaga traderom zrozumieć, kto aktualnie kontroluje rynek: kupujący czy sprzedający. Zamiast polegać tylko na świecach cenowych, wskaźnik analizuje presję stojącą za ruchem. To czyni go użytecznym do potwierdzania wejść, unikania słabych sygnałów, identyfikowania odwróceń, wykrywania absorpcji oraz zauważania zmian momentum zanim staną się one oczywiste na cenie.
Tryb momentum ticków jest szczególnie przydatny do skalpowania na żywo, ponieważ reaguje na impulsy cenowe w czasie rzeczywistym, podczas gdy narzędzia CVD i wygładzona Delta pomagają potwierdzić, czy ruch ma za sobą prawdziwą siłę.
Najlepiej używać do
- Skalpowania
- Handlu intraday
- Potwierdzania momentum
- Potwierdzania odwróceń
- Analizy zmiatania płynności
- Handlu dywergencjami Delta i CVD
- Złota, Indeksów, Kryptowalut, Ropy i par Forex
- M1, M5 i innych niższych interwałów czasowych
Ważna uwaga
Ten wskaźnik jest narzędziem wspomagającym decyzje analityczne. Nie gwarantuje zysków i powinien być używany razem z odpowiednim zarządzaniem ryzykiem, strukturą rynku oraz przetestowanym planem handlowym.
Podsumowanie
Additional functionalities include detection of bullish and bearish Delta and CVD divergences, absorption detection to identify pressure that fails to move price, and signal arrows for buy/sell opportunities alongside prediction arrows for early momentum shifts. It incorporates session filters for Asia, London, and New York trading sessions, volatility and spread guards, volume ratio filters, and a smart confluence engine with directional scoring.
CVD Ai supports markets such as Forex, Gold, Indices, Crypto, and Oil, and is optimized for scalping, intraday trading, and short-term momentum confirmation on lower timeframes like M1 and M5. It offers strategy templates for specific symbols including US30, USTECH, XAUUSD, BTCUSD, and Oil. The indicator includes an info dashboard displaying bias, Delta, smoothed Delta, CVD, momentum, pressure percentage, and reset mode options.
Opinie klientów
5 | 0 % | |
4 | 100 % | |
3 | 0 % | |
2 | 0 % | |
1 | 0 % |


