
Opis
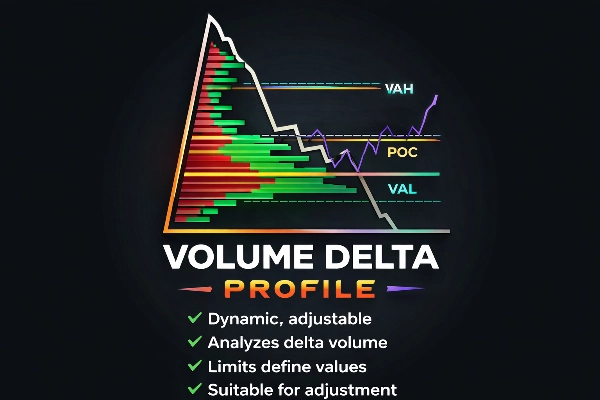
Profil Delta Wolumenu
Profesjonalny wgląd w przepływ zleceń dla zaawansowanych traderów
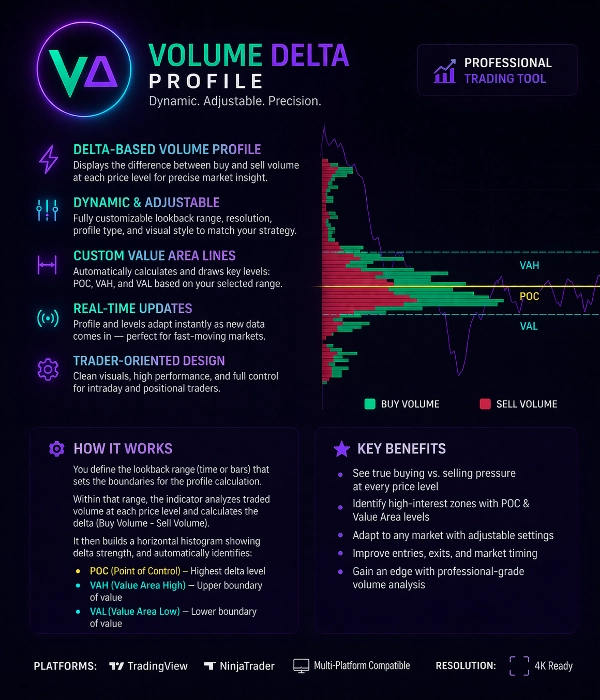
Profil Delta Wolumenu to potężne narzędzie handlowe zaprojektowane, aby ujawnić prawdziwą równowagę między kupującymi a sprzedającymi na każdym poziomie cenowym.
W przeciwieństwie do tradycyjnych profili wolumenu, ten wskaźnik analizuje Delta Wolumenu (Wolumen Kupna – Wolumen Sprzedaży), aby pokazać, gdzie dominują agresywni uczestnicy rynku.
Pomaga traderom zidentyfikować aktywność instytucjonalną, strefy absorpcji oraz poziomy cen o wysokim zainteresowaniu z precyzją.
Główne funkcje
Profil wolumenu oparty na delcie
Wskaźnik oblicza deltę wolumenu na każdym poziomie cenowym, rozdzielając:
• Agresywną presję kupna
• Agresywną presję sprzedaży
To ujawnia, kto faktycznie kontroluje rynek.
Dynamiczny i regulowany zakres profilu
Zakres obliczeń profilu jest w pełni konfigurowalny.
Użytkownicy mogą definiować obszar obliczeń poprzez:
• Niestandardowy zakres świec
• Zakres sesji
• Ręczny wybór
• Dynamiczny zakres przesuwany
Profil automatycznie aktualizuje się wraz z napływem nowych danych.
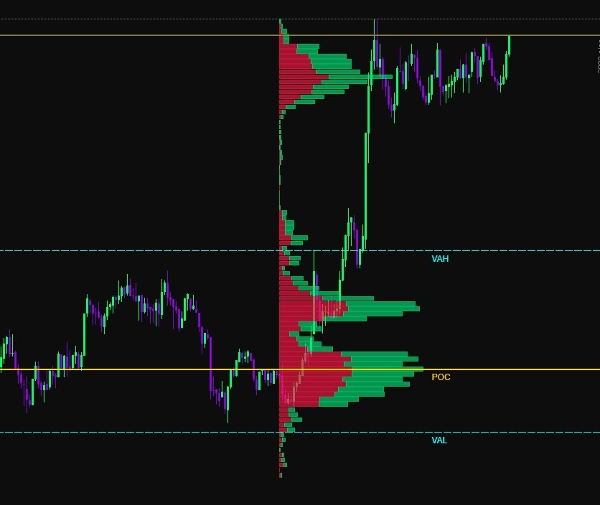
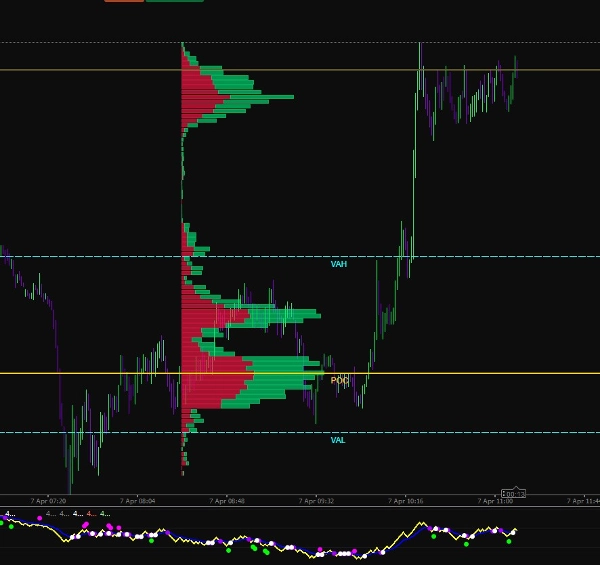
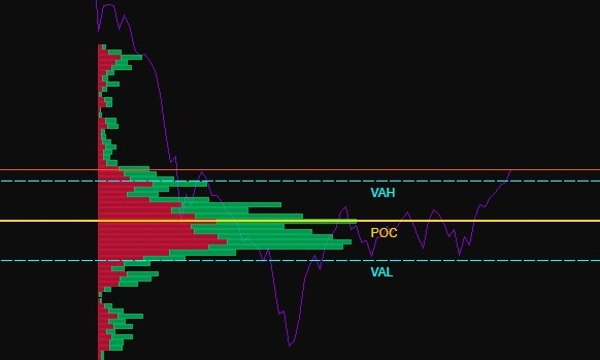
Wykrywanie obszaru wartości
Wskaźnik automatycznie oblicza kluczowe poziomy struktury rynku:
POC (Punkt Kontroli)
Poziom cenowy z najwyższym obrotem delta wolumenu.
VAH (Górna granica obszaru wartości)
Górna granica obszaru wartości.
VAL (Dolna granica obszaru wartości)
Dolna granica obszaru wartości.
Te poziomy podkreślają, gdzie odbyła się większość aktywności rynkowej.
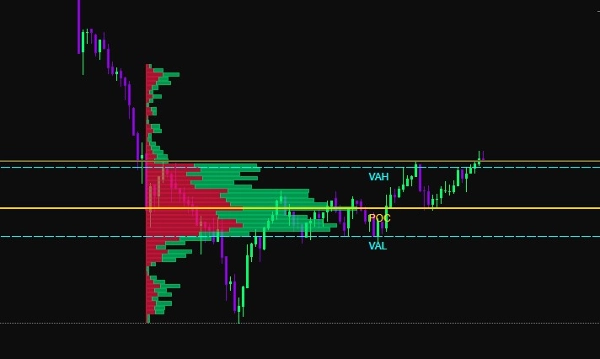
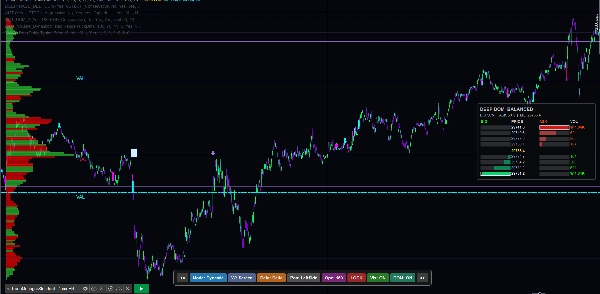
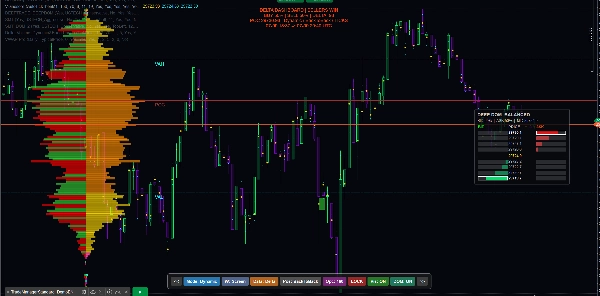
Wizualizacja kupna vs sprzedaży
Wolumen jest wyświetlany jako poziomy histogram:
Zielone słupki → Dominujący wolumen kupna
Czerwone słupki → Dominujący wolumen sprzedaży
To pozwala traderom natychmiast zobaczyć:
• Strefy absorpcji
• Obszary nierównowagi
• Klastry płynności
• Ślady instytucjonalne
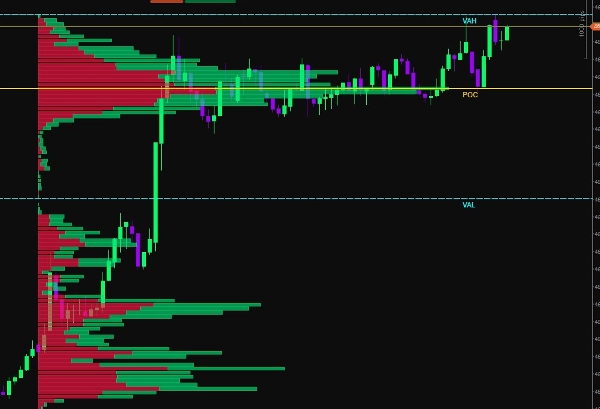
Adaptacyjna wizualizacja
Wskaźnik zawiera wiele opcji dostosowywania wizualnego:
• Regulowana szerokość histogramu
• Niestandardowe schematy kolorów
• Regulowana przezroczystość
• Kontrola rozdzielczości
• Renderowanie adaptacyjne do zoomu
To zapewnia czytelną wizualizację na wszystkich interwałach czasowych wykresu.
Inteligentne poziomy graniczne
Wskaźnik rysuje dynamiczne poziomy odniesienia:
• Linia POC
• Linia VAH
• Linia VAL
Te poziomy aktualizują się automatycznie na podstawie wybranego zakresu profilu i mogą być używane jako:
• Wsparcie / Opór
• Strefy powrotu do średniej
• Poziomy potwierdzające wybicie
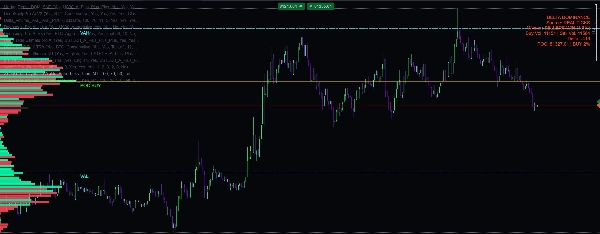
Obliczenia w czasie rzeczywistym
Profil Delta Wolumenu jest ciągle przeliczany na podstawie danych rynkowych na żywo.
To zapewnia traderom zawsze aktualne informacje o przepływie zleceń podczas szybkich ruchów rynkowych.
Zastosowania
To narzędzie jest idealne do:
• Skalpowania
• Handlu intraday
• Handlu kontraktami terminowymi
• Analizy przepływu zleceń
• Śledzenia płynności
• Wykrywania śladów instytucjonalnych
Kluczowe zalety handlowe
✔ Identyfikacja rzeczywistej presji kupna vs sprzedaży
✔ Wykrywanie stref absorpcji i wyczerpania
✔ Lokalizacja poziomów wysokiej płynności
✔ Poprawa precyzji wejścia
✔ Potwierdzanie wybicia lub odwrócenia
✔ Zrozumienie struktury rynku
Specyfikacje techniczne
Metoda obliczeń:
Delta Wolumenu = Wolumen Kupna − Wolumen Sprzedaży
Typ profilu:
Poziomy histogram cenowy
Poziomy automatyczne:
POC, VAH, VAL
Tryb aktualizacji:
Aktualizacja dynamiczna w czasie rzeczywistym
Ustawienia niestandardowe:
• Zakres profilu
• Rozdzielczość histogramu
• Skalowanie wolumenu
• Ustawienia kolorów
• Widoczność poziomów
Kompatybilność platformy:
Optymalizowany pod kątem wysokowydajnego renderowania wykresów
Stworzony dla profesjonalnych traderów
Profil Delta Wolumenu jest stworzony dla traderów, którzy chcą wyjść poza podstawowe wskaźniki i zrozumieć prawdziwe mechanizmy rynku.
Łącząc analizę wolumenu, obliczenia delty oraz strukturę obszaru wartości, to narzędzie zapewnia jasny obraz uczestnictwa rynku i rozkładu płynności.
Podsumowanie
Users can customize the profile calculation range using options such as custom bar range, session range, manual selection, or rolling dynamic range, with real-time updates as new market data arrives. Key market structure levels—Point of Control (POC), Value Area High (VAH), and Value Area Low (VAL)—are automatically calculated and drawn as dynamic reference lines, useful for support/resistance, mean reversion, and breakout confirmation.
Additional features include adjustable histogram width, color schemes, transparency, resolution control, and zoom-adaptive rendering for clear visualization across all chart timeframes. The tool supports use cases like scalping, intraday trading, futures trading, order flow analysis, liquidity tracking, and institutional footprint detection. It is optimized for high-performance chart rendering and aims to provide traders with precise insights into market participation and liquidity distribution.


