
Opis
🧭 Synchronizuj swoje transakcje z zegarem: Atlas pokazuje, kiedy rynki mają tendencję do ruchu według miesiąca, dnia tygodnia i godziny. 🧭
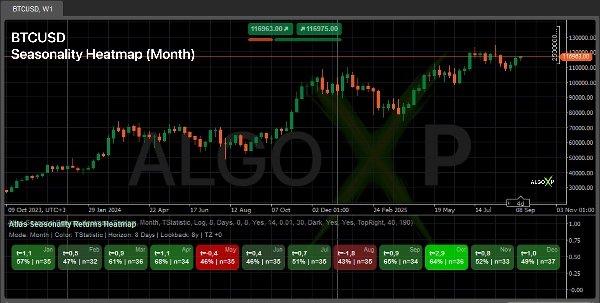
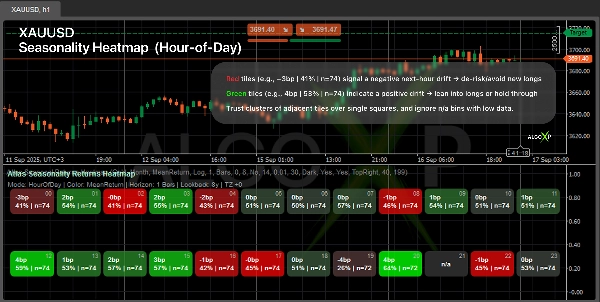
Zobacz, kiedy Twój rynek ma tendencję do ruchu — według miesiąca, dnia tygodnia lub godziny dnia.
Atlas oblicza przyszłe zwroty na wybranym przez Ciebie horyzoncie i tworzy symetryczną mapę cieplną (Spadek → Zero → Wzrost). Każda płytka pokazuje miarę (Średnia, Statystyka t lub Sharpe) oraz % trafień | n. Użyj tego do timingu wejść/wyjść, planowania sesji i filtrowania ryzyka.
🎯 Dlaczego traderzy go używają
- Wykrywaj zielone okna, by angażować się, oraz czerwone okna, by się wycofać.
- Planuj sesje wokół statystycznie korzystnych godzin/dni.
- Dodaj czystą warstwę „kiedy” do strategii dyskrecjonalnych i systematycznych.
⚙️ Jak to działa
- Patrzy w przyszłość na wybrany przez Ciebie okres i podsumowuje, jak cena zwykle zachowuje się w tym okresie.
- Grupuje wyniki w przedziały czasowe (Miesiąc / Dzień tygodnia / Godzina) i uwzględnia Twoją strefę czasową.
- Stosuje ochronę przed wartościami odstającymi oraz solidny wskaźnik siły dla każdego przedziału (oraz wielkość próby).
- Tworzy zrównoważoną mapę cieplną wokół neutralnego punktu, używając Twoich kolorów Wzrost / Zero / Spadek.
👥 Dla kogo jest to przeznaczone
- Traderzy dyskrecjonalni — lepszy timing i wielkość pozycji według sesji.
- Twórcy systemów i botów — filtr czasowy / dostosowanie wielkości pozycji według czasu dla strategii.
- Traderzy kryptowalut i indeksów — szybkie wzorce zachowań w ciągu dni/godzin.
- Początkujący — prosta interpretacja: bardziej zielony = bardziej pozytywne nastawienie na wybranym horyzoncie.
🚀 Szybki start
- Wybierz Preset aktywów (Forex/Krypto/Indeks/Złoto).
- Ustaw Horyzont (np. 1 godzina dla HOD, 1 dzień dla DOW/Miesiąc).
- Dostosuj Okres analizy, Minimalną liczbę obserwacji i kolory.
- Odczytuj klastry (kilka sąsiadujących zielonych/czerwonych płytek) dla najsilniejszych sygnałów.
ℹ️ Sezonowość nie gwarantuje przyszłych wyników. To wzorzec statystyczny zależny od okresu i metodologii. Używaj wskaźnika jako kontekstu dla swoich zasad wejścia/wyjścia i zarządzania ryzykiem, testuj solidność na różnych okresach analizy i unikaj polegania na przedziałach z małą liczbą próbek (n).
Podsumowanie
The indicator supports multiple asset presets including Forex, Crypto, Indices, and Commodities, and respects the user’s timezone. It applies outlier protection and calculates a robust strength score per time bucket to ensure reliable insights. Users can customize parameters like lookback period, minimum observations, and color schemes.
Atlas is suitable for discretionary traders seeking better timing and sizing, system and bot builders needing a time-based filter or sizing layer, crypto and index traders analyzing behavioral patterns, and beginners looking for a straightforward indication of positive or negative market bias. It provides a statistical context for entry/exit decisions and risk management but should be used alongside other analysis tools.
Opinie klientów
5 | 50 % | |
4 | 50 % | |
3 | 0 % | |
2 | 0 % | |
1 | 0 % |


