
Descrizione
La suite definitiva delle candele giapponesi è qui per aiutarti a rilevare la maggior parte dei pattern di candele esistenti oggi.
I pattern di candele, che sono strumenti tecnici di trading, sono stati utilizzati per secoli per prevedere la direzione del prezzo. Esistono vari pattern di candele utilizzati per determinare la direzione e lo slancio del prezzo, tra cui three line strike, two red gapping, three red crows, evening star e abandoned baby.
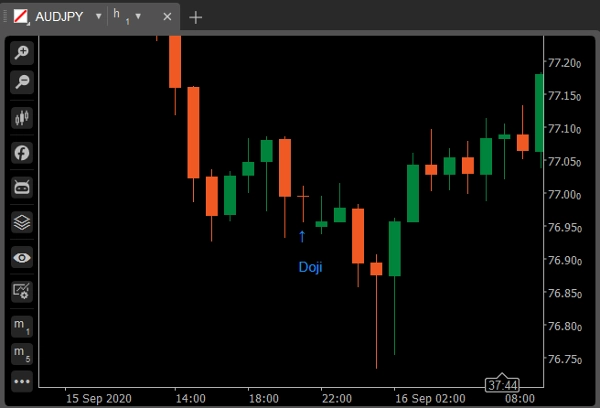
Doji
Una candela doji si forma quando l'apertura e la chiusura di un titolo sono praticamente uguali per il periodo di tempo considerato e generalmente segnala un pattern di inversione per gli analisti tecnici. La soglia del corpo è al massimo del 5% della lunghezza totale.
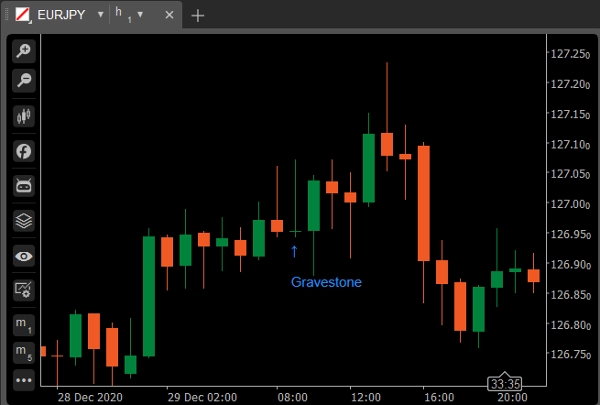
Variante: Gravestone Doji
Si forma quando i prezzi massimo, apertura e chiusura dell'asset sono (quasi) gli stessi. La lunga ombra inferiore suggerisce che durante il periodo della candela c'è stata una vendita aggressiva, ma poiché il prezzo ha chiuso vicino all'apertura, mostra che gli acquirenti sono riusciti ad assorbire la vendita e a spingere il prezzo di nuovo verso l'alto.
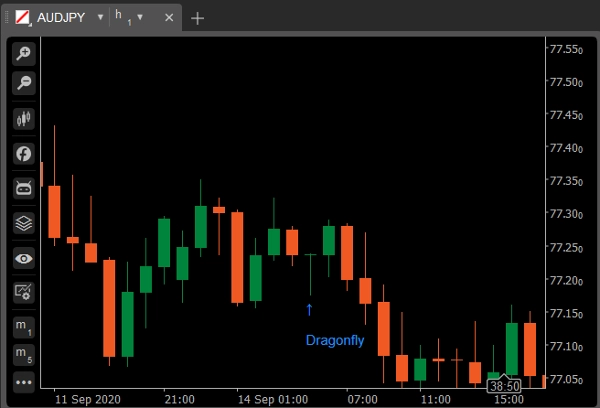
Variante: Dragonfly Doji
Un gravestone doji si verifica quando i prezzi minimo, apertura e chiusura sono (quasi) gli stessi, e la candela ha una lunga ombra superiore. Il gravestone assomiglia a una "T" capovolta. Le implicazioni per il gravestone sono le stesse del dragonfly. Entrambi indicano possibili inversioni di tendenza ma devono essere confermati dalla candela successiva.
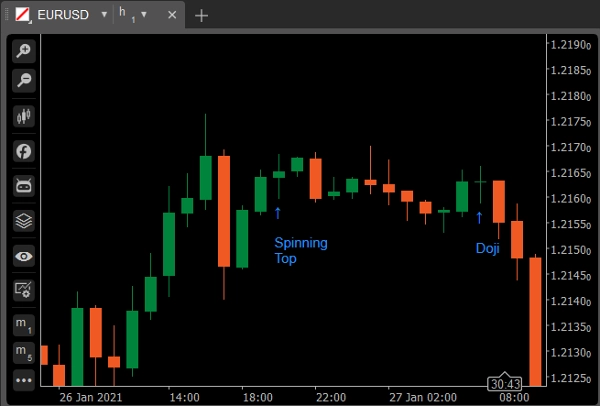
Spinning Top
Uno spinning top è un pattern di candela con un corpo reale corto, centrato verticalmente tra lunghe ombre superiori e inferiori. Il pattern di candela rappresenta indecisione sulla direzione futura dell'asset. Né gli acquirenti né i venditori sono riusciti a prevalere. La soglia del corpo è al massimo del 20% della lunghezza totale.
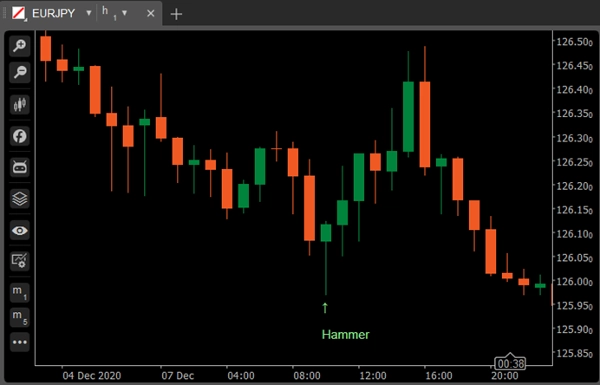
Hammer
Hammer Una candela verde o rossa che consiste in un piccolo corpo vicino al massimo con poca o nessuna ombra superiore e una lunga coda inferiore. Considerato un pattern rialzista durante un trend ribassista.
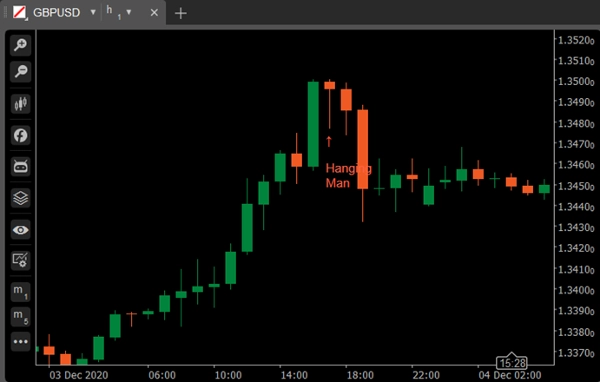
Variante: Hanging Man
Una candela verde o rossa che consiste in un piccolo corpo vicino al massimo con poca o nessuna ombra superiore e una lunga coda inferiore. Considerato un pattern ribassista durante un trend rialzista.
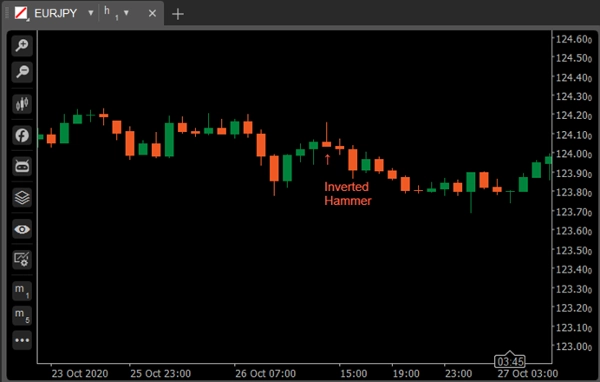
Inverted Hammer
L'inverted hammer è un tipo di pattern di candela che si trova dopo un trend ribassista ed è solitamente considerato un segnale di inversione di tendenza.
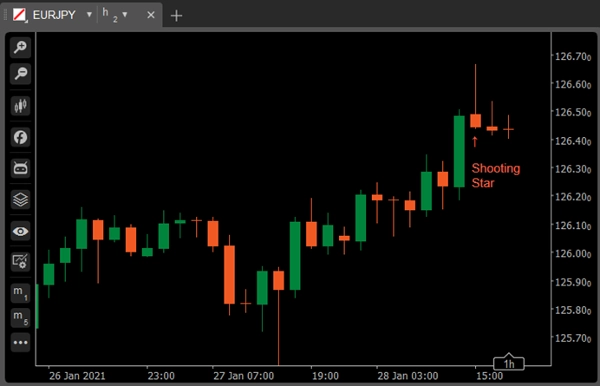
Variante: Shooting Star
La Shooting Star appare esattamente come l'inverted hammer, ma invece di trovarsi in un trend ribassista si trova in un trend rialzista e quindi ha implicazioni diverse.
Marubozu
Una candela lunga o normale (rossa o verde) senza ombra o coda. Il massimo e il minimo rappresentano i prezzi di apertura e chiusura. Considerato un pattern di continuazione.
Variante: Marubozu Open
Per il Marubozu open, il prezzo di apertura dovrebbe essere piatto: cioè l'azione del prezzo dovrebbe muoversi solo in una direzione, ma a differenza della candela Marubozu completa, il prezzo di chiusura dall'altra parte può differire leggermente dal massimo/minimo. In altre parole, l'apertura dovrebbe essere piatta, mentre c'è spazio per una breve ombra dall'altra parte.
Variante: Marubozu Close
La candela Marubozu close è l'opposto del Marubozu open: la chiusura dovrebbe essere piatta mentre l'azione del prezzo può muoversi leggermente nella direzione opposta prima di iniziare a muoversi aggressivamente in una direzione.
Bullish Engulfing
Consiste in un corpo rosso più piccolo contenuto all'interno della successiva grande candela verde. Quando appare in fondo è interpretato come un segnale di inversione importante.
Bearish Engulfing
Consiste in un corpo verde più piccolo contenuto all'interno della successiva grande candela rossa. Quando appare in cima è considerato un segnale di inversione importante.
Piercing Line
Piercing Line consiste in una candela rossa seguita da una candela verde che apre più in basso del minimo della precedente ma chiude più della metà del corpo della candela rossa. È considerato un segnale di inversione quando appare in fondo.
Dark Shadow Cover
Consiste in una lunga candela verde seguita da una candela rossa che apre sopra il massimo della candela verde e chiude ben dentro il corpo della candela verde. È considerato un segnale di inversione ribassista durante un trend rialzista.
Bullish Harami
Consiste in un corpo rosso insolitamente grande seguito da un piccolo corpo verde (contenuto nel grande corpo rosso). È considerato un pattern rialzista quando preceduto da un trend ribassista.
Variante: Bullish Harami Cross
Un grande corpo rosso seguito da un Doji. È considerato un segnale di inversione quando appare in fondo.
Bearish Harami
Bearish Harami consiste in un corpo verde insolitamente grande seguito da un piccolo corpo rosso (contenuto in un grande corpo verde). È considerato un pattern ribassista quando preceduto da un trend rialzista.
Variante: Bearish Harami Cross
Un grande corpo verde seguito da un Doji. Considerato un segnale di inversione quando appare in cima.
Bullish/Bearish Kicker
Il segnale Bullish Kicker si verifica spesso dopo una grande sorpresa nelle notizie annunciata prima o dopo l'orario di mercato. È successo qualcosa di drastico, causando un grande cambiamento nel sentimento degli investitori, e inevitabilmente seguirà un'inversione. Più grande è il gap tra le due candele, più significativo è il segnale.
Morning/Evening Star
Consiste in una grande candela verde seguita da una piccola candela (rossa o verde) che apre sopra la precedente. La terza è una candela rossa che chiude ben dentro il grande corpo verde. È considerato un segnale di inversione quando appare al livello superiore.
Variante: Abandoned Baby
Three Green Soldiers/Three Red Crows
Consiste in tre lunghe candele verdi con chiusure consecutivamente più alte. I prezzi di chiusura sono vicini o al massimo. Quando appare in fondo è interpretato come un segnale di inversione di fondo.
Consiste in tre lunghe candele rosse con chiusure consecutivamente più basse. I prezzi di chiusura sono vicini o al minimo. Quando appare in cima è considerato un segnale di inversione di massimo.
Three Line Strike
Un three line strike è un gruppo di candele di continuazione che ha tre candele nella direzione di un trend seguite da una candela finale che torna indietro fino al punto di partenza. I trader usano il three line strike come opportunità per comprare a un minimo recente del trend o vendere a un massimo recente.
Two Red Gapping
Il pattern di continuazione ribassista two red gapping appare dopo un notevole massimo in un trend rialzista, con un gap verso il basso che produce due barre rosse con minimi più bassi. Questo pattern prevede che il calo continuerà fino a minimi ancora più bassi.
Riepilogo
Recensioni dei clienti
5 | 100 % | |
4 | 0 % | |
3 | 0 % | |
2 | 0 % | |
1 | 0 % |


