
说明
将复合指数应用于RSI时,最好的理解方式是将RSI视为Windows 3.0,而复合指数则是Windows 10。Constance Brown发现,虽然RSI确实能够创建和检测背离,但其准确性并不如预期。说RSI是一个没有任何动量计算的动量指标,这听起来有些矛盾。RSI会错过大量重要的走势,甚至会产生一些错误信号。Constance Brown对RSI所做的是在RSI内部引入了动量计算。该指数消除了RSI中的归一化范围限制,这意味着它不再局限于0-100的范围内。
RSI与复合指数的结合
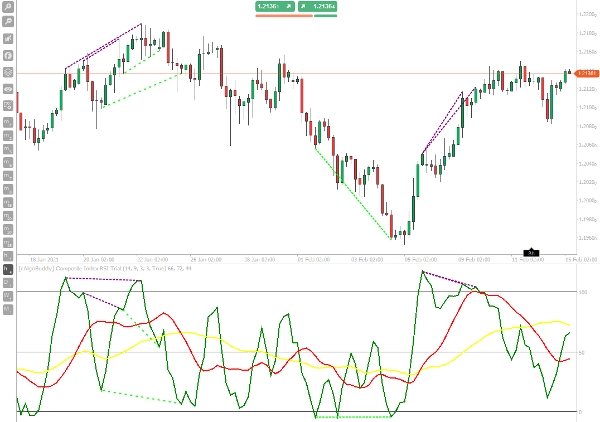
Constance Brown使用复合指数的一种策略是将复合指数与RSI进行比较。当我们寻找背离时,会寻找如看涨背离这样的情况。看涨背离发生在价格创出更高高点时,而振荡器却显示更低高点。当我们同时使用RSI和复合指数时,我们将RSI视为价格图表,而复合指数则是振荡器。
该指标内部有一个标准的RSI线用于识别背离,因此这部分工作已经为您完成。像使用其他振荡器一样交易背离信号。
复合指数的主要特点是以清晰的操作信号来表示动量。因此,当RSI进入超买或超卖区域时,复合指数与其移动平均线在相反方向的交叉代表一个良好的交易信号,然后,将振荡器动量与价格在支撑和阻力上的动作结合起来,您将获得一个非常有趣且成功的交易逻辑,这也非常适合加密货币交易。
使用方法
复合指数策略是一种基于支撑和阻力水平与相对强弱指数及复合指数的超买超卖水平相结合的动量价格行为策略。在此交易策略中,复合指数也是最终的入场时机。
时间框架:H1及以上,始终与RSI一起使用。
买入
- 价格在支撑位反弹。
- 复合RSI移动平均线低于50水平,且快速均线(红色)低于慢速均线(黄色)。
- RSI形成低点,数值接近或低于30,同时复合指数也有低点。
- 当复合指数向上穿越移动平均线时,我们做多。
卖出
- 价格在阻力位反弹。
- 复合移动平均线高于50水平,且快速均线(红色)高于慢速均线(黄色)。
- RSI形成高点,数值接近或高于70,同时复合指数也有高点。
- 当复合指数向下穿越移动平均线时,我们做空(这就是入市时机)。
摘要
指标配置
客户评价
4.0
评价:1
5 | 0 % | |
4 | 100 % | |
3 | 0 % | |
2 | 0 % | |
1 | 0 % |
讨论
常见问答
Forex
Signal
Breakout
Indices
EURUSD
Commodities
RSI
XAUUSD
cTrader Store 提供的所有产品,包括交易机器人、指标和插件,均由第三方开发者提供,仅供信息参考和技术访问之用。cTrader Store 并非经纪商,不提供投资建议、个人推荐或任何未来业绩保证。
该作者的其他作品


价格
11
销售