
GUPPY-MASTER V3
Chỉ báo
251 lượt tải
Phiên bản 1.0, Mar 2026
Windows, Mac
5.0
Đánh giá: 3
Kể từ 27/02/2026
33.16K
Khối lượng đã giao dịch
25.96K
Pip đạt được
8
Lượt bán
391
Cài đặt miễn phí
Mô tả
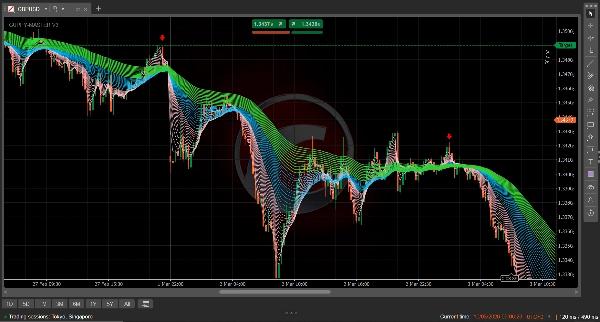
GUPPY TREND MASTER V3 (CÔNG NGHỆ GIAO DỊCH 4X4)
Hình dung tâm lý thị trường với Cầu Vồng EMA 38
Công cụ Guppy Trend Master 4X4 là một công cụ phân tích kỹ thuật cao cấp dành cho cTrader, biến các hành động giá phức tạp thành một bản đồ tâm lý thị trường rõ ràng, được mã hóa màu sắc. Bằng cách vẽ đồng thời 38 Đường Trung Bình Động Lũy Thừa (EMA), nó cho phép các nhà giao dịch phân biệt giữa "nhiễu" tạm thời và các đảo chiều xu hướng thực sự.
Logic Trực Quan 4X4
Chỉ báo tổ chức dữ liệu thị trường thành ba "dải" riêng biệt để cung cấp cho bạn cái nhìn đa chiều về xu hướng:
- Dải Hồng (Chu kỳ 2–15): Nhóm "Nhà Đầu Cơ". Những đường này đại diện cho các nhà giao dịch ngắn hạn. Khi chúng xòe ra, động lượng cao. Khi chúng thu lại, chuyển động đang cạn kiệt.
- Dải Xanh Dương (Chu kỳ 17–41): Nhóm "Cầu Nối". Đây là vùng chuyển tiếp quan trọng. Nó thường đóng vai trò là khu vực "đẩy bật" để vào lại trong một xu hướng mạnh.
- Dải Xanh Lá (Chu kỳ 44–74): Nhóm "Nhà Đầu Tư". Đại diện cho tâm lý dài hạn. Một dải xanh lá rộng và xòe ra biểu thị một xu hướng mạnh mẽ, ổn định và khó bị phá vỡ.
Tại Sao Sử Dụng Chỉ Báo?
- Xác Nhận Xu Hướng Ngay Lập Tức: Nhìn ngay để biết thị trường đang trong xu hướng hay đi ngang. Nếu các dải rối vào nhau, hãy đứng ngoài. Nếu chúng xòe ra và tách biệt, xu hướng mạnh.
- Vùng Scalping Chính Xác: Được tối ưu đặc biệt cho khung thời gian M1 và M5, 4X4 làm nổi bật các vùng "Mua khi giảm" và "Bán khi tăng" với độ chính xác như phẫu thuật.
- Hình Ảnh Biến Động: "Khoảng cách" giữa các dải cho bạn biết mức độ chắc chắn đằng sau một chuyển động. "Khoảng cách rõ ràng" (như trong logic 4X4) cho thấy môi trường giao dịch có xác suất cao.
- Logic Không Trễ: Bằng cách sử dụng Đường Trung Bình Động Lũy Thừa (EMA), 4X4 phản ứng với biến động giá nhanh hơn các chỉ báo Guppy dựa trên SMA tiêu chuẩn, làm cho nó vượt trội trong các thị trường tần suất cao hiện đại.
Cách Đọc Tín Hiệu
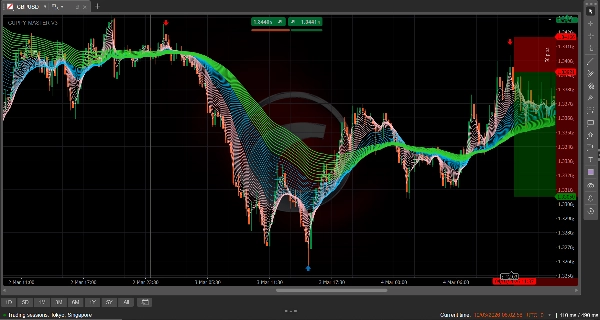
- Sức Mạnh Tăng Giá: Màu Hồng ở trên cùng, tiếp theo là Xanh Dương, với Xanh Lá ở dưới cùng. Tất cả các nhóm đều xòe lên với khoảng cách rõ ràng giữa các đường.
- Sức Mạnh Giảm Giá: Màu Xanh Lá ở trên cùng, tiếp theo là Xanh Dương, với Hồng ở dưới cùng. Tất cả các nhóm đều xòe xuống.
- Sự Ép Chặt: Khi cả ba nhóm hội tụ về một điểm duy nhất, một đợt bùng nổ lớn sắp xảy ra.
Tóm tắt
Tóm tắt AI
The GUPPY TREND MASTER V3 is a technical analysis indicator designed for the cTrader platform that visualizes market sentiment using 38 Exponential Moving Averages (EMAs). It organizes these EMAs into three color-coded ribbons to provide a multi-dimensional view of market trends: the Pink Ribbon (periods 2–15) reflects short-term speculator activity, the Blue Ribbon (periods 17–41) serves as a transitional bridge zone, and the Green Ribbon (periods 44–74) indicates long-term investor sentiment. This structure helps traders distinguish between market noise and genuine trend reversals.
Key features include instant trend confirmation by observing ribbon separation or entanglement, precision scalping zones optimized for 1- and 5-minute timeframes, and visualization of market volatility through the spacing between ribbons. The use of EMAs ensures faster reaction to price changes compared to traditional SMA-based Guppy indicators, supporting high-frequency trading environments.
Signal interpretation is based on ribbon positioning and spacing: bullish trends show Pink above Blue above Green with upward fanning, bearish trends show the reverse with downward fanning, and convergence of all ribbons signals an imminent breakout. The indicator supports various markets including forex pairs (GBPUSD, USDJPY), cryptocurrencies, stocks, and commodities like gold (XAUUSD).
Hồ sơ chỉ báo
Đánh giá của khách hàng
5.0
Đánh giá: 3
5 | 100 % | |
4 | 0 % | |
3 | 0 % | |
2 | 0 % | |
1 | 0 % |
Đánh giá của khách hàng
March 29, 2026
This is a nice indicator 😀. Overall the images are what is represented on the chart no faking. But only the arrows missing. Let me hope version 2 has them.
March 17, 2026
Very good 👍👍 indicator. Have looked for it every where finally I found it works every well
Thảo luận
Câu hỏi thường gặp
Signal
Breakout
Scalping
GBPUSD
Crypto
Stocks
XAUUSD
NAS100
USDJPY
Các sản phẩm có sẵn trên cTrader Store, bao gồm bot giao dịch, chỉ báo và plugin, được cung cấp bởi các nhà phát triển bên thứ ba và chỉ nhằm mục đích cung cấp thông tin và tiếp cận kỹ thuật. cTrader Store không phải là nhà môi giới và không cung cấp lời khuyên đầu tư, khuyến nghị cá nhân hay bất kỳ đảm bảo nào về hiệu suất trong tương lai.


Bạn cũng có thể thích


Giá
Kể từ 27/02/2026
33.16K
Khối lượng đã giao dịch
25.96K
Pip đạt được
8
Lượt bán
391
Cài đặt miễn phí