
Descripción
Qué analiza este indicador
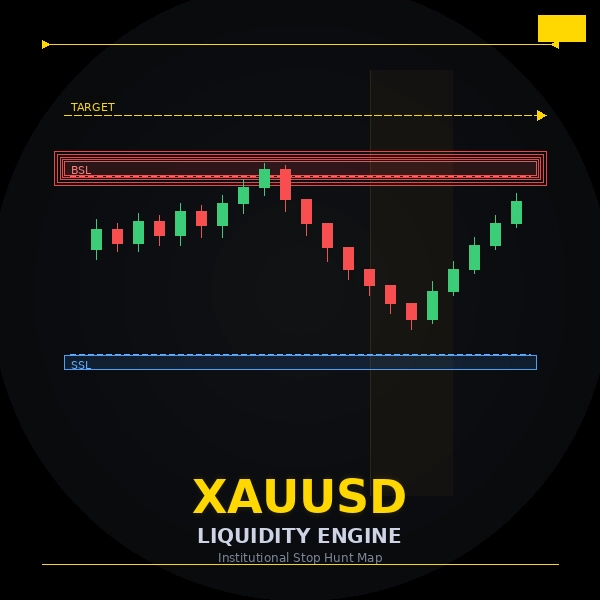
El Motor de Liquidez XAUUSD mapea los grupos de stop-loss por encima y por debajo del precio — la liquidez en reposo hacia la que el precio es atraído repetidamente antes de revertir. Puntúa cada zona por probabilidad, resalta el objetivo más probable en cada lado y arma una configuración completa de trading cuando tu sesgo de sesión y un objetivo coinciden.
Construido exclusivamente para Oro (XAUUSD). Funciona en M5, M15, M30 y H1.
Nuevo en v2.1 — el marco completo de killzone ICT
Las killzones ahora están ancladas a la hora local de Nueva York y se ajustan automáticamente al horario de verano de EE.UU., por lo que las ventanas permanecen correctas todo el año — no solo la mitad. Se incluyen las cuatro killzones ICT:
- Asiática killzone
- Londres killzone
- Nueva York killzone
- Cierre de Londres killzone
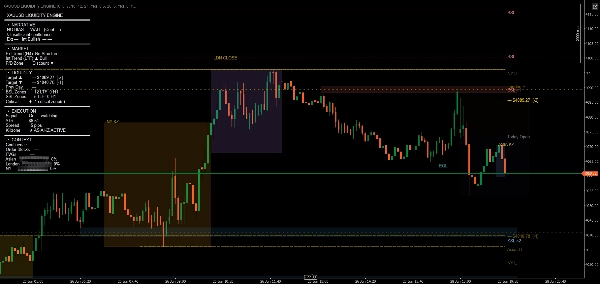
Cada killzone se dibuja como una caja limitada al máximo y mínimo de esa sesión — el rango real que se negoció en la sesión — en lugar de una franja de fondo de altura completa. Ese rango es la liquidez: el máximo y mínimo de la sesión son exactamente los niveles que buscan las sesiones posteriores.
Cómo leer el gráfico
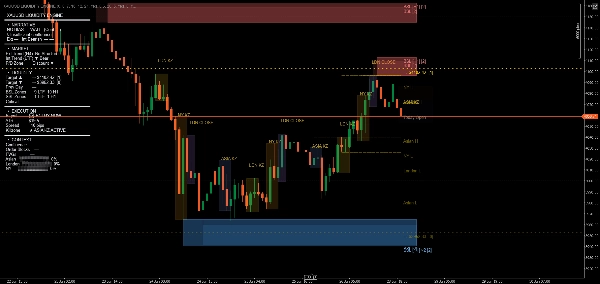
- Zonas rojas (BSL) — grupos de stops del lado comprador por encima del precio. A menudo barridas antes de una caída.
- Zonas azules (SSL) — grupos de stops del lado vendedor por debajo del precio. Frecuentemente tocadas antes de una subida.
- ★ Zonas premium — puntuadas entre 7 y 10 según siete factores de confluencia (superposición MTF H1, FVG, máximos/mínimos iguales, nivel de sesión, PDH/PDL, número redondo, nivel imán). Destacan en el gráfico.
- Cajas killzone — las cuatro sesiones ICT, cada una enmarcando su propio rango de máximo a mínimo.
- Líneas objetivo de liquidez — el objetivo con mayor probabilidad por encima y por debajo del precio, cada uno con una insignia de puntuación.
- Máximo / Mínimo del día anterior — dibujados en el límite de día medianoche-Nueva York de ICT y extendidos hasta el final del día de trading actual, para que los niveles clave de hoy siempre estén visibles.
- Panel de configuración de trading — cuando el sesgo de sesión y un objetivo se alinean, el panel muestra Dirección, Zona de entrada, Stop, Objetivo y R:R.
El panel de control
Un panel seccionado en el gráfico muestra la imagen actual de un vistazo:
- Narrativa — lectura en lenguaje sencillo del sesgo y objetivo
- Mercado — estructura H4 / LTF y zona premium / descuento
- Liquidez — objetivos, niveles del día anterior, conteos de zonas BSL / SSL
- Ejecución — señal en vivo, ATR, spread, killzone activa
- Contexto — confluencia, bloques de órdenes, FVGs, participación en la sesión
El contraste del texto ahora se adapta automáticamente al fondo de tu gráfico — legible en un gráfico blanco o oscuro sin necesidad de cambiar configuración.
Tres modos
- Principiante — solo zonas, objetivos y sesgo de sesión. Gráfico limpio, decisiones mínimas.
- Estándar (recomendado) — añade FVGs, contexto de rango, puntuación de confluencia y el Panel de Configuración de Trading.
- Pro — panel completo con bloques de órdenes, zonas MTF H1, superposición de señal y todas las capas de inteligencia.
Configuraciones clave
- Modo — Principiante / Estándar / Pro; controla qué capas son visibles
- Killzones — las cuatro ventanas ICT en hora de Nueva York, con ajuste automático por horario de verano (ajustable individualmente)
- Base del día anterior — medianoche ICT Nueva York (por defecto) o diario del broker
- Proximidad de confluencia — qué tan cerca deben estar los niveles para contar como confluencia
- Edad máxima de la zona — cuántas barras antes de que una zona se desvanezca
- Distancia objetivo (ATR) — rango máximo de búsqueda para objetivos de liquidez
Casos de uso típicos
- Planificación previa a la sesión — ver qué grupo de stops Londres o Nueva York probablemente barrerá
- Entradas tras barridos — esperar a que un BSL / SSL sea tomado, luego actuar en el retesteo
- Selección de objetivos — usar las líneas objetivo puntuadas para enmarcar tu take-profit
- Temporización de la sesión — operar con las ventanas killzone ICT en lugar de contra ellas
Para quién es esto
- Operadores de oro en M5–H1 que usan análisis ICT, SMC o basado en liquidez
- Operadores que quieren estructura sin redibujar zonas cada sesión
- Principiantes que quieren una vista limpia y guiada (modo Principiante)
- Operadores avanzados que quieren la imagen institucional completa (modo Pro)
Notas importantes
- Optimizado para XAUUSD. Los parámetros por defecto están ajustados para la volatilidad del oro.
- Las killzones usan la hora local de Nueva York y se ajustan automáticamente al horario de verano de EE.UU.
- El sesgo de sesión usa estructura H4 — permite cargar más de 200 barras de historial para una lectura inicial precisa.
- El Panel de Configuración de Trading requiere que estén habilitados tanto el sesgo de sesión como los objetivos de liquidez.
- El filtro de picos de volumen se desactiva automáticamente en brokers sin datos de volumen por tick.
ASSET 2 — Entrada de historial de versión (v2.1)
Elige el número de versión que se ajuste a tu esquema — v2.1 es el paso natural desde la v2.0 en vivo.
Versión 2.1 — junio 2026
- Nuevo: Ahora se incluyen las cuatro killzones ICT — Asiática, Londres, Nueva York y Cierre de Londres (antes solo Londres + Nueva York).
- Nuevo: Killzones ancladas a la hora local de Nueva York con manejo automático del horario de verano de EE.UU. — las ventanas permanecen correctas todo el año.
- Cambiado: Cada killzone ahora se dibuja como una caja limitada al máximo y mínimo real de esa sesión (el rango de la sesión), en lugar de una banda de altura completa.
- Cambiado: El máximo / mínimo del día anterior ahora usa el límite de día medianoche-Nueva York de ICT y se extiende hasta el final del día de trading actual.
- Nuevo: Contraste automático del panel — el texto se adapta automáticamente a un fondo claro u oscuro del gráfico.
- Mejorado: Panel reorganizado en secciones claras (Narrativa / Mercado / Liquidez / Ejecución / Contexto).
- Mejorado: Etiquetas en el borde derecho — niveles, objetivos y configuración de trading — se separan en una columna limpia; las etiquetas killzone se escalonan para que las sesiones adyacentes nunca se superpongan.
ASSET 3 — Plan de capturas (8 espacios)
Reglas generales de captura:
- Captura durante horas activas del mercado para que el spread sea realista y pueda imprimirse una señal (evita el estado de fin de semana "Spread 40 pips / Signal Off" en las imágenes principales).
- Mantén un zoom consistente y un gráfico limpio (oculta objetos no relacionados).
- El contraste automático maneja ambos temas — considera una captura con fondo claro y otra oscura para mostrar el rango.
- Usa el mismo símbolo XAUUSD para mantener la consistencia.
#Captura Qué debe mostrar Por qué vende
1
Resumen principal
Modo estándar, gráfico completo: 4 cajas killzone, PDH/PDL, líneas objetivo, panel legible
Primera impresión — "esta es una herramienta completa y profesional para Oro"
2
Las 4 killzones
Un día completo con cajas Asia / Londres / NY / Cierre de Londres etiquetadas, cada una ajustada a su rango de sesión
La característica principal de la v2.1; indica la corrección genuina de ICT
3
Señal activa ⭐
Modo Pro, superposición de señal ACTIVADA, configuración impresa: zona de entrada, etiquetas SL / TP1 / TP2, R:R, Panel de Configuración de Trading completo
Muestra la característica principal de configuración de trading Y la columna de etiquetas limpia
4
Zonas de liquidez
Zonas BSL (rojas) + SSL (azules) con zonas premium ★ destacadas, puntuaciones visibles
Demuestra el motor de puntuación / probabilidad
5
Objetivos de liquidez
Líneas objetivo doradas discontinuas por encima/debajo del precio con insignias de puntuación
Muestra la proyección del "próximo objetivo" de un vistazo
6
Detalle del panel
Panel recortado y ampliado con las cinco secciones legibles
Demuestra profundidad sin saturar el gráfico
7
Tres modos
Principiante vs Estándar vs Pro (recortes apilados o lado a lado)
Muestra la progresión limpia→completa; amplía la base de compradores
8
Niveles clave
PDH/PDL extendidos hasta el final del día + etiquetas H/L de sesión en una columna ordenada
Refuerza el valor de "siempre conoce tus niveles"
Prioridad si solo actualizas unos pocos: #1, #2, #3 llevan la actualización. #3 también es la última confirmación de QA — capturarla verifica que las etiquetas SL/TP no se superpongan con una señal en vivo.
Resumen
Key features include color-coded liquidity zones (red for buy-side stops above price, blue for sell-side stops below), premium zones scored across multiple confluence factors, and liquidity target lines with probability scores. The indicator also displays Previous Day High/Low levels based on the ICT midnight-New York day boundary.
A comprehensive on-chart dashboard provides a plain-language narrative of session bias and objectives, market structure, liquidity details, execution signals, and contextual information such as order blocks and fair value gaps. The dashboard adapts text contrast automatically for light or dark chart backgrounds.
Users can select from three modes—Beginner (simplified view), Standard (adds confluence and trade setup), and Pro (full institutional-level detail). The indicator supports pre-session planning, entry timing after liquidity sweeps, target selection, and session timing aligned with ICT killzones.
Valoraciones de clientes
5 | 33 % | |
4 | 67 % | |
3 | 0 % | |
2 | 0 % | |
1 | 0 % |


