
HTFBB
Indicador
1 compras
Versión 1.0, Jul 2025
Windows, Mac
5.0
Valoraciones: 1
Descripción
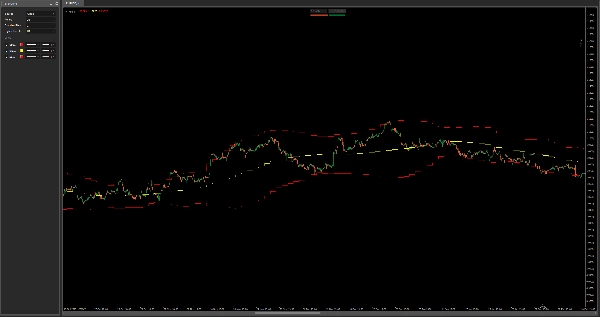
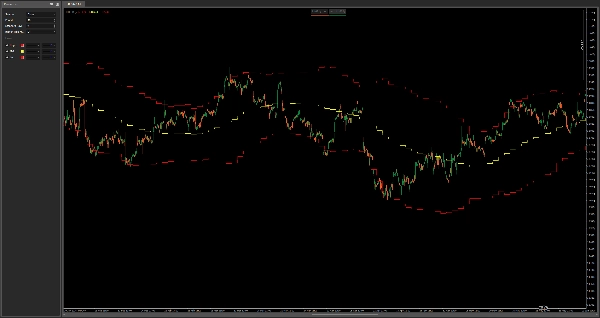
Bandas de Bollinger HTF – Mapa de Volatilidad Multitemporal
Este indicador traza Bandas de Bollinger de un marco temporal superior en tu gráfico actual, brindándote un contexto poderoso para la volatilidad, la reversión a la media y el soporte/resistencia dinámicos, todo sin cambiar de marco temporal.
Características:
- Muestra las Bandas de Bollinger superior, media e inferior de cualquier marco temporal superior seleccionable
- Ideal para identificar zonas de consolidación HTF, presión de ruptura y retrocesos de tendencia
- Ideal para scalping y entradas intradía con conciencia del marco temporal superior
- Funciona en todos los activos y marcos temporales
Combínalo con tu estrategia actual para evitar operar en trampas de volatilidad y mantenerte alineado con la estructura macro del precio.
Resumen
Perfil del indicador
Valoraciones de clientes
5.0
Valoraciones: 1
5 | 100 % | |
4 | 0 % | |
3 | 0 % | |
2 | 0 % | |
1 | 0 % |
Valoraciones de clientes
July 29, 2025
confusing signals get easier to ignore, but a clean signal can still fail.
Conversación
Preguntas frecuentes
Los productos disponibles a través de cTrader Store, incluidos bots, indicadores y plugins para operar, son proporcionados por desarrolladores de terceros y están disponibles únicamente con fines informativos y de acceso técnico. cTrader Store no es un bróker, por lo que no proporciona asesoramiento de inversión, recomendaciones personales ni ninguna garantía de rentabilidad futura.


Precio
Desde 03/01/2025
638.03K
Volumen operado
21.34K
Pips ganados
15
Ventas