
VixFix
Indicador
Versión 1.0, Jul 2025
Windows, Mac
4.0
Valoraciones: 1
Descripción
Indicador VixFix para cTrader
Detecta el pánico del mercado antes de que llegue a las noticias.
Este indicador VixFix es una adaptación inteligente del concepto clásico “VIX Fix” de Larry Williams—diseñado para ayudar a los traders a detectar picos de miedo y volatilidad a corto plazo, especialmente útil para identificar posibles fondos del mercado.
Cómo Funciona
- Calcula un pico pseudo-volatilidad comparando el mínimo reciente con el máximo más alto durante un período configurable (por defecto: 12).
- Aplica un promedio móvil y una envolvente de desviación estándar para separar picos de señal del ruido normal.
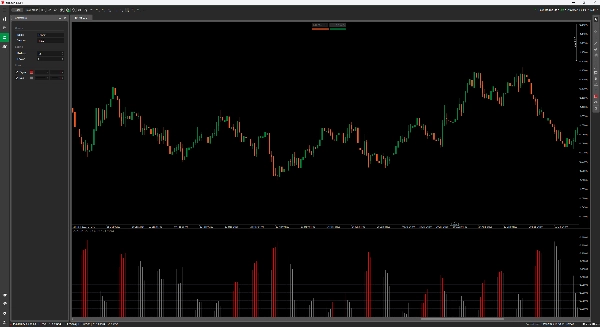
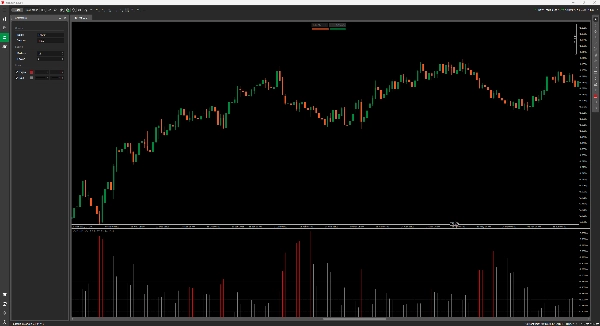
- Dibuja barras de histograma rojas cuando la volatilidad supera el umbral—tu señal para empezar a prestar atención.
Características
- Visualización limpia del histograma (sin superposición)
- Gráfico bicolor:
-
- Rojo = Señal (pico de volatilidad por encima del umbral)
- Gris = Actividad normal
- Períodos ajustables y factor de sensibilidad
- Cero retardo del indicador—usa solo la acción del precio en crudo, sin repintado
Casos de Uso
- Detecta posibles reversiones en tendencias bajistas
- Temporiza operaciones de reversión a la media
- Confirma condiciones de sobreventa sin depender del RSI u otras herramientas con retardo
Resumen
Perfil del indicador
Valoraciones de clientes
4.0
Valoraciones: 1
5 | 0 % | |
4 | 100 % | |
3 | 0 % | |
2 | 0 % | |
1 | 0 % |
Conversación
Preguntas frecuentes
Los productos disponibles a través de cTrader Store, incluidos bots, indicadores y plugins para operar, son proporcionados por desarrolladores de terceros y están disponibles únicamente con fines informativos y de acceso técnico. cTrader Store no es un bróker, por lo que no proporciona asesoramiento de inversión, recomendaciones personales ni ninguna garantía de rentabilidad futura.


Precio
Desde 03/01/2025
638.03K
Volumen operado
21.34K
Pips ganados
15
Ventas