


Beschreibung
#### Funktionen
- **Anpassbarer Zeitraum**: Benutzer können einen bestimmten Zeitraum (z. B. täglich) auswählen, um Eröffnungsniveaus zu analysieren. Setzen Sie keinen TF < 1H.
- **Rückblickzeitraum**: Der Indikator unterstützt einen Rückblickzeitraum, der es Händlern ermöglicht, sich auf die jüngste Kursentwicklung zu konzentrieren und relevante Interessenspunkte zu identifizieren.
- **Dynamische Trendlinien**: Er zeichnet Trendlinien, um den Eröffnungspreis des ausgewählten Zeitrahmens anzuzeigen und bietet klare visuelle Hinweise auf potenzielle Unterstützungs- und Widerstandsniveaus.
- **Beschriftungsoptionen**: Händler können Beschriftungen aktivieren, um den Eröffnungspreis direkt im Chart anzuzeigen, was die Klarheit und das Verständnis verbessert.
- **Visuelle Anpassung**: Benutzer können Linienfarben, -stile und -dicken an ihre Vorlieben anpassen und die Lesbarkeit des Charts verbessern.
- **Zeitrahmenbeschränkungen**: Der Indikator enthält Prüfungen, um sicherzustellen, dass er nur innerhalb der angegebenen minimalen und maximalen Zeitrahmeneinstellungen arbeitet und so irreführende Signale verhindert.
#### Anleitung
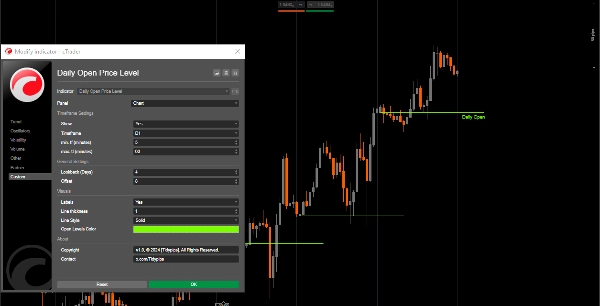
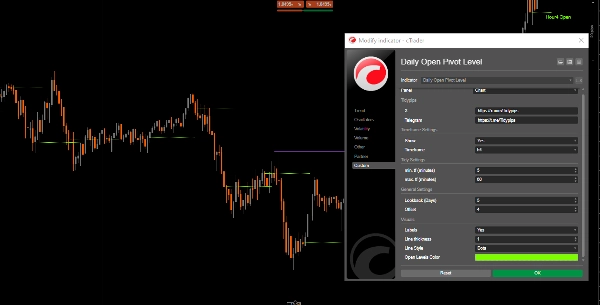
1. **Einrichtung**: Öffnen Sie die Indikatoreinstellungen, um Ihren gewünschten Zeitraum, Rückblickzeitraum auszuwählen und visuelle Parameter wie Linienfarbe und -dicke anzupassen.
2. **Verwendung des Indikators**: Nach der Anwendung zeichnet der Indikator automatisch die Eröffnungspreisebenen basierend auf den angegebenen Einstellungen in Ihrem Chart ein.
3. **Analyse**: Beobachten Sie die eingezeichneten Niveaus während des Handels. Nutzen Sie diese Niveaus, um potenzielle Unterstützungs- und Widerstandsbereiche zu identifizieren und fundierte Handelsentscheidungen zu treffen.
#### Empfohlene Begleitwerkzeuge
- **cTrader**: Die native Plattform für cAlgo, die ein nahtloses Erlebnis für die Nutzung und Anpassung von Indikatoren bietet.
- **Technische Analysewerkzeuge**: Kombinieren Sie diesen Indikator mit anderen Werkzeugen wie gleitenden Durchschnitten oder Oszillatoren, um Ihre Handelsstrategie und Marktanalyse zu verbessern.
- **Risikomanagement-Tools**: Nutzen Sie Positionsgrößenrechner und Stop-Loss-Werkzeuge, um das Risiko beim Handel um die identifizierten Eröffnungsebenen effektiv zu steuern.
Durch die Integration des Daily Open Pivot Level Indicators mit diesen Werkzeugen können Händler ihre Marktanalyse verbessern und ihre Erfolgschancen bei der Navigation durch die Komplexität des Intraday-Handels erhöhen.
Zusammenfassung
Kundenbewertungen
5 | 100 % | |
4 | 0 % | |
3 | 0 % | |
2 | 0 % | |
1 | 0 % |


