
Descripción
*EL HORARIO DE APERTURA SERÁ DIFERENTE ENTRE LAS CLASES DE ACTIVOS
*LOS VALORES DE TIEMPO PREDETERMINADOS SON PARA NQ/ES/YM (FUTUROS)
*EL VALOR DE TIEMPO DEBE ESTAR EN HORARIO ESTÁNDAR DEL ESTE (EST)
Características clave:
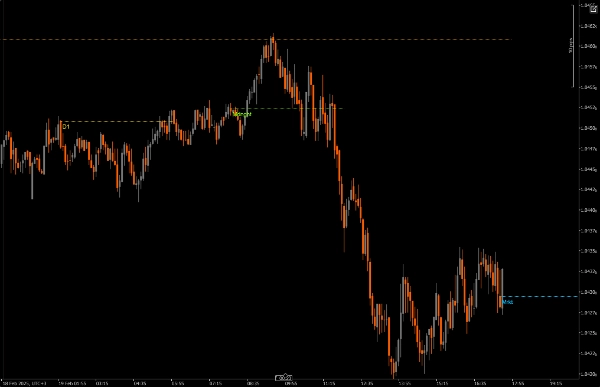
Niveles de precio basados en el tiempo
Traza líneas de precio de apertura en los precios de apertura de los momentos clave del mercado
Todos los horarios están sincronizados con el Horario Estándar del Este (EST)
Cada período de tiempo está codificado por colores para una fácil identificación
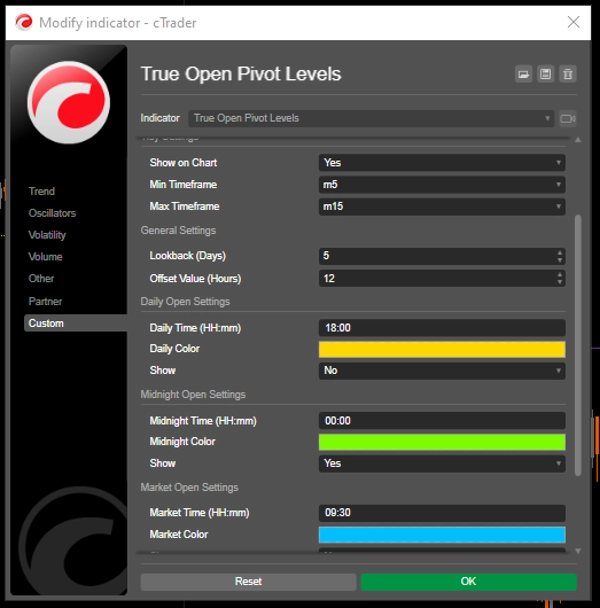
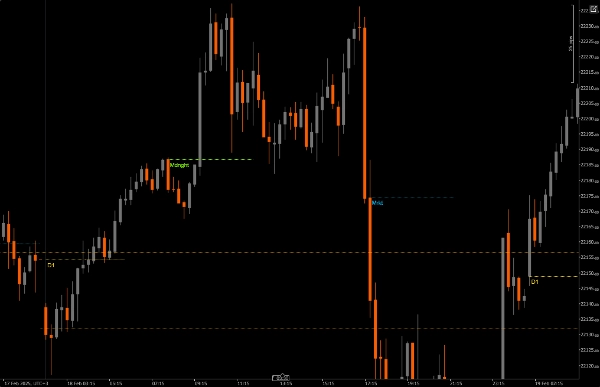
3 Marcadores de sesión personalizables:
Apertura diaria (12:00 AM EST) - Oro predeterminado
Apertura de medianoche (4:00 AM EST) - Verde predeterminado
Apertura del mercado (9:30 AM EST) - Azul predeterminado
Cada sesión puede activarse o desactivarse de forma independiente
Personalización visual:
Grosor de línea ajustable
Múltiples estilos de línea (sólido, punteado, discontinuo)
Colores personalizables para cada sesión
Etiquetas de tiempo opcionales que muestran horas EST
Desplazamiento de línea configurable hasta 48 horas
Soporte flexible de marcos temporales:
Establece marcos temporales mínimos y máximos para la visualización
Evita la saturación del gráfico en marcos temporales inapropiados
Optimizado para marcos temporales M5-M15
Configuración de tiempo:
Todos los horarios están en EST
Personaliza los horarios de sesión para que coincidan con tu estrategia de trading
Ajusta la duración de la línea según tus necesidades de análisis
Configuración visual:
Ajusta el grosor de la línea para mayor visibilidad
Elige el estilo de línea según la claridad del gráfico
Activa o desactiva las etiquetas según sea necesario
Personaliza los colores para que coincidan con el tema de tu gráfico
Configuración general:
Define marcos temporales mínimos/máximos
Ajusta la duración de la línea para análisis extendidos
Mejores prácticas:
Comienza con la configuración predeterminada y ajusta según tus necesidades
Usa diferentes colores para cada sesión para una diferenciación clara
Considera reducir la duración de la línea en marcos temporales bajos para evitar saturación
Activa las etiquetas inicialmente para entender el tiempo, desactívalas si el gráfico se vuelve demasiado cargado
Ajusta la configuración del marco temporal del indicador a tu marco temporal de trading
Este indicador es particularmente útil para:
Operadores diarios enfocados en los mercados de EE. UU.
Operadores que necesitan seguir las aperturas de sesión
Quienes operan alrededor de eventos importantes del mercado
Operadores que analizan la acción del precio en múltiples sesiones
Cualquiera que necesite una referencia visual clara para los horarios del mercado EST
Resumen
Valoraciones de clientes
5 | 100 % | |
4 | 0 % | |
3 | 0 % | |
2 | 0 % | |
1 | 0 % |


