Descrizione
Consente agli utenti di segnare gli orari di apertura e chiusura delle principali sessioni di trading—Asiatica, Londra, New York e Chiusura di Londra—con colori, stili e spessori personalizzabili. Questo indicatore traccia linee di tendenza alte e basse per ogni sessione, fornendo approfondimenti sul comportamento del mercato. Con una funzionalità intuitiva di trascinamento e rilascio (+tasto Alt) rende rapido il tracciamento degli alti e bassi delle sessioni. Perfetto sia per trader principianti che esperti, questo indicatore facilita la navigazione nelle complessità delle diverse sessioni di mercato.
Caratteristiche
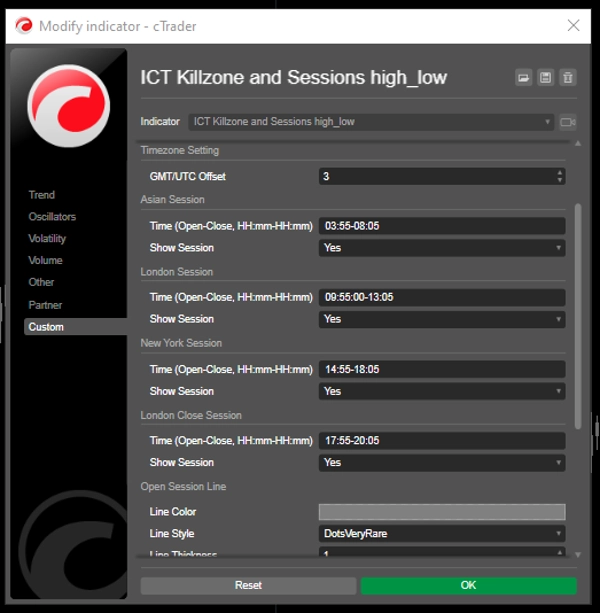
Orari di Sessione Personalizzabili: Gli utenti possono definire gli orari di apertura e chiusura per le principali sessioni di trading (Asiatica, Londra, New York e Chiusura di Londra), permettendo una visualizzazione su misura che si adatta alle loro strategie di trading.
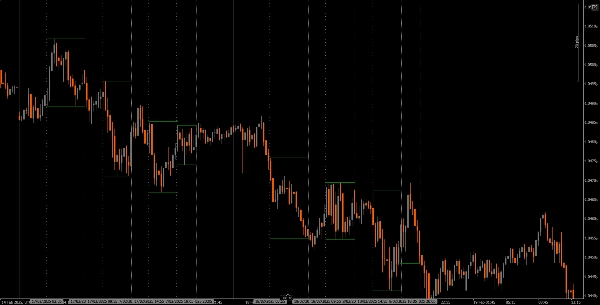
Linee Verticali Dinamiche: L'indicatore traccia linee verticali agli orari di apertura e chiusura delle sessioni, facilitando l'identificazione immediata degli eventi chiave di mercato.
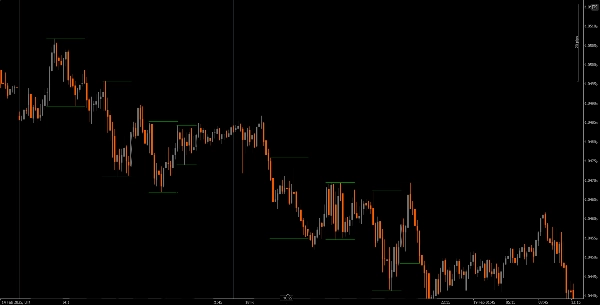
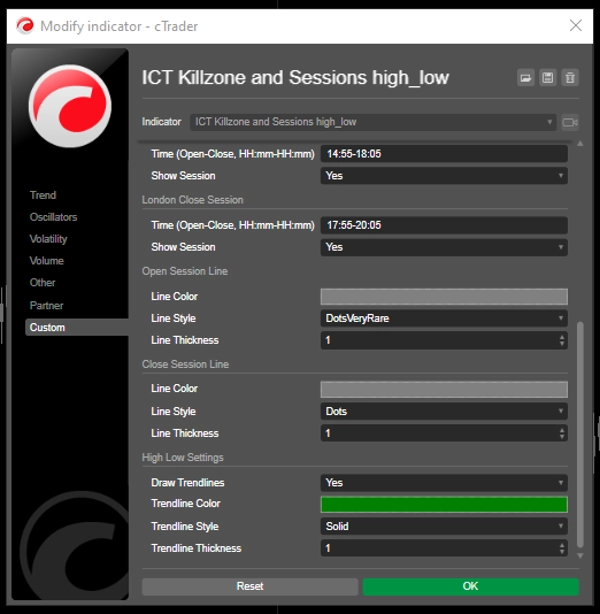
Visualizzazione delle Linee di Tendenza: Può tracciare automaticamente linee di tendenza alte e basse per ogni sessione, permettendo ai trader di vedere potenziali livelli di supporto e resistenza basati sull'azione del prezzo della sessione.
Trascinamento e Rilascio Intuitivo (+tasto Alt): La funzionalità di trascinamento e rilascio (+tasto Alt) consente ai trader di selezionare facilmente intervalli di tempo specifici da analizzare, migliorando l'esperienza utente complessiva.
Etichette delle Sessioni: L'opzione di visualizzare etichette accanto alle linee di tendenza delle sessioni aggiunge chiarezza, aiutando i trader a identificare rapidamente quale sessione stanno analizzando.
Regolazione del Fuso Orario: Gli utenti possono impostare un offset GMT/UTC, assicurando che gli orari delle sessioni siano rappresentati accuratamente secondo il loro fuso orario locale.
Tutorial
Installazione: Scarica e installa l'indicatore The ICT Killzone and Sessions high_low sulla tua piattaforma cAlgo.
Configurazione: Apri le impostazioni per personalizzare gli orari delle sessioni, i colori, gli stili delle linee e lo spessore secondo le tue preferenze.
Utilizzo dell'Indicatore: Clicca e trascina (+ tasto Alt) sul grafico per creare un rettangolo che comprenda l'intervallo di tempo che vuoi analizzare. L'indicatore traccerà automaticamente linee verticali e linee di tendenza per le sessioni specificate.
Analisi: Osserva le linee delle sessioni e le linee di tendenza mentre fai trading. Usa queste informazioni per identificare potenziali livelli di supporto e resistenza basati sulla dinamica delle sessioni.
Strumenti Consigliati in Abbinamento
cTrader: La piattaforma nativa per cAlgo, che offre un'esperienza fluida per l'uso e la personalizzazione degli indicatori.
Strumenti di Analisi di Mercato: Combina questo indicatore con strumenti di analisi di mercato, come medie mobili o oscillatori, per migliorare la tua strategia di trading.
Strumenti di Gestione del Rischio: Usa calcolatori della dimensione della posizione e strumenti di stop-loss per gestire efficacemente il rischio durante il trading.
Integrando l'indicatore The ICT Killzone and Sessions high_low con questi strumenti, i trader possono migliorare la loro analisi di mercato e aumentare le probabilità di successo nel navigare le complessità delle diverse sessioni di trading.
Riepilogo
A drag-and-drop (+Alt Key) feature allows quick selection of specific time ranges for analysis. Optional session labels clarify which session is being viewed. Timezone adjustments via GMT/UTC offset ensure session times align with the trader’s local time zone.
Designed for use on the cAlgo platform, this tool supports enhanced market analysis when combined with other market analysis and risk management tools. It assists traders in navigating the complexities of different market sessions by providing clear visual cues and trendline insights.
Recensioni dei clienti
5 | 40 % | |
4 | 20 % | |
3 | 0 % | |
2 | 0 % | |
1 | 40 % |