
Drawing Utility
Indikator
208 downloads
Version 1.0, Jul 2025
Windows, Mac
Beschreibung
Alt + Ziehen, um es in Ihren Charts zu aktivieren.
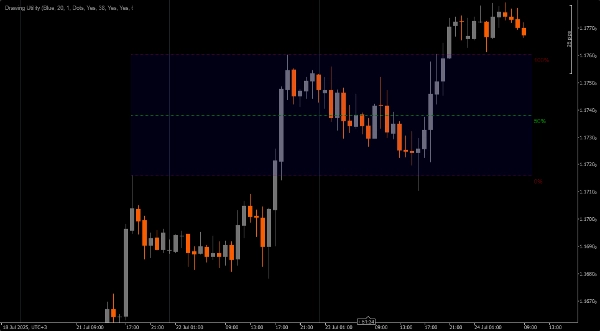
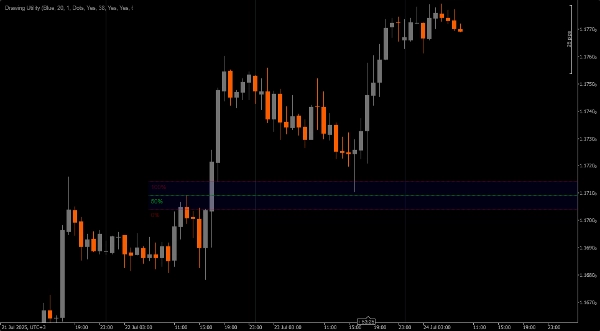
Anpassbares Zeichenwerkzeug.
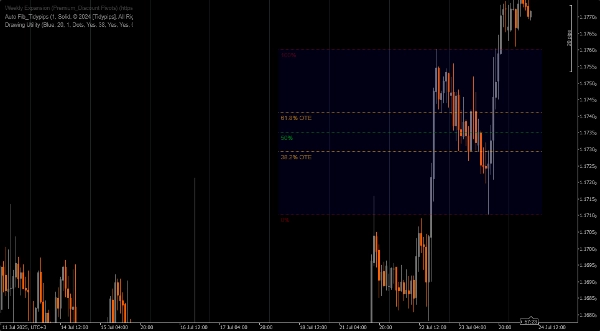
1. Schneller Zugriff auf Fibonacci.
2. Fair Value Gap Markierung
3. Messwerkzeug
4. Point Of Interest Markierung
5. oder jede andere Verwendung (an die ich nicht gedacht habe), die Sie passend finden, um Ihre Charts zu annotieren
HINWEIS **Alt + Ziehen, um es in Ihren Charts zu aktivieren.**
Zusammenfassung
KI-Zusammenfassung
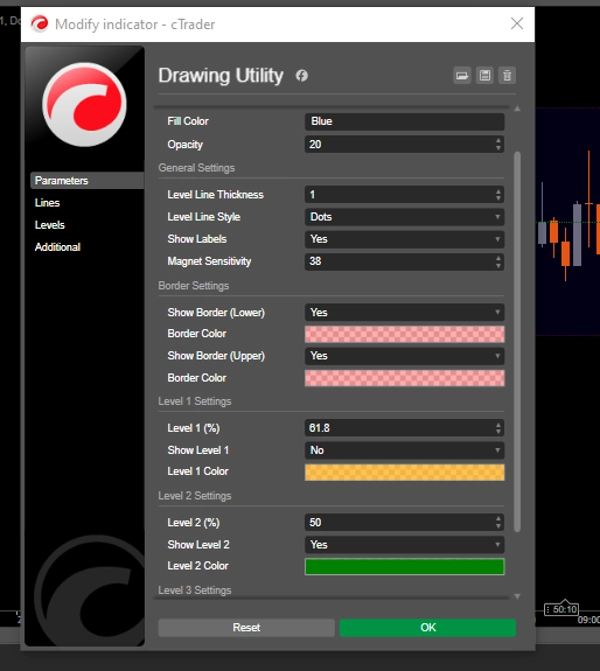
Drawing Utility is a customizable chart annotation tool designed for trading platforms. It features a rectangular box with five adjustable Fibonacci levels, which can also be customized to user-defined values. The utility is activated by pressing Alt and dragging on the chart. Key functionalities include quick access to Fibonacci retracement levels, marking Fair Value Gaps, measuring price movements, and highlighting Points of Interest. Additionally, it supports flexible use cases for various chart annotations, allowing traders to tailor it to their specific analysis needs.
Indikatorprofil
Kundenbewertungen
0.0
Bewertungen: 0
Kundenbewertungen
Bisher gibt es keine Bewertungen für dieses Produkt. Haben Sie es schon ausprobiert? Dann können Sie die erste Person sein, die andere darüber informiert!
Diskussion
Häufig gestellte Fragen (FAQ)
Über den cTrader Store verfügbare Produkte, einschließlich Handelsbots, Indikatoren und Plugins, werden von externen Entwicklern bereitgestellt und nur zu Informations- und technischen Zugriffszwecken verfügbar gemacht. cTrader Store ist kein Broker und erbringt keine Anlageberatung, persönlichen Empfehlungen oder eine Garantie für zukünftige Performance.
Mehr von diesem Autor


Preis
15
Verkäufe
4.63K
Kostenlose Installationen