Descrizione
Indice di Momentum Stocastico (SMI) è un oscillatore stocastico raffinato progettato per misurare il momentum in modo più fluido rispetto a uno Stocastico classico. Questa implementazione per cTrader corrisponde alla formulazione comunemente usata su TradingView applicando doppia smussatura EMA sia all'intervallo relativo che all'intervallo massimo-minimo, producendo una curva di momentum pulita e stabile che funziona bene sia in condizioni di trend che di range.
Cosa mostra
- L'SMI misura dove si trova la chiusura rispetto al punto medio dell'intervallo massimo-minimo recente, normalizzato e scalato.
- I valori tendono a oscillare tra -100 e +100.
- I livelli di riferimento di ipercomprato/ipervenduto (predefiniti +40 / -40) aiutano a identificare condizioni estreme e momentum tesi.
Grafici
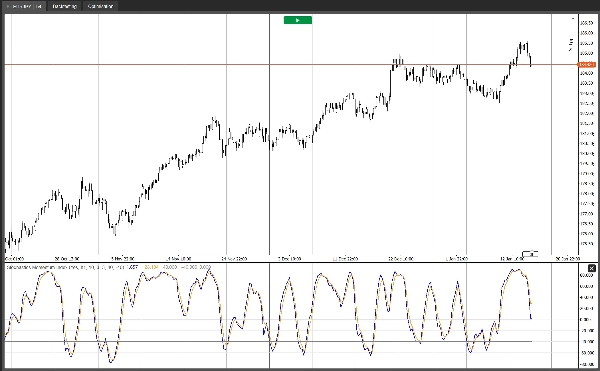
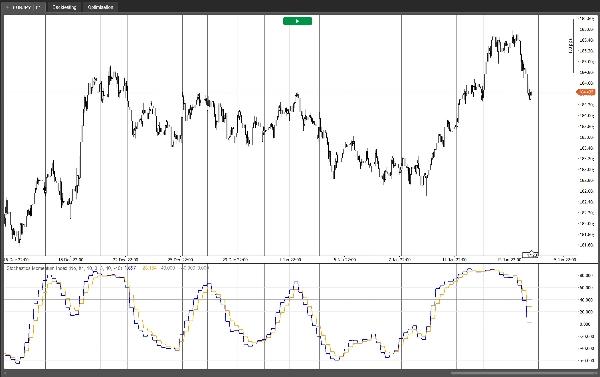
- SMI: la linea principale del momentum.
- EMA basata su SMI: una linea di segnale (EMA dell'SMI) per incroci e conferme.
- Livelli di Ipercomprato / Ipervenduto / Medio (0) per un contesto visivo rapido.
Come lo usano i trader
- Regimi di trend: Usa la linea 0 come filtro direzionale (sopra 0 = pressione rialzista, sotto 0 = pressione ribassista) e negozia i ritracciamenti tramite incroci tra SMI e linea di segnale nella direzione del trend.
- Regimi di ritorno alla media: Contrasta gli estremi quando l'SMI torna da ipercomprato/ipervenduto e conferma con un incrocio, spesso puntando alla linea 0 come primo obiettivo di ritorno alla media.
- Divergenze: La divergenza di momentum tra prezzo e SMI può evidenziare potenziali oscillazioni in indebolimento.
Opzione multi-timeframe
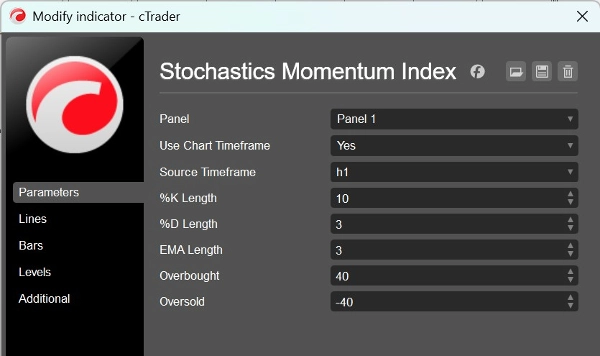
- Seleziona un Timeframe di origine per calcolare l'SMI da un timeframe superiore mentre lo visualizzi sul grafico corrente (ideale per filtrare il rumore e migliorare la qualità del segnale).
- Oppure abilita Usa il timeframe del grafico per mantenere i calcoli sul timeframe corrente.
Input
- Lunghezza %K: finestra di lookback per il massimo più alto / minimo più basso.
- Lunghezza %D: lunghezza di smussatura usata nel calcolo della doppia EMA.
- Lunghezza EMA: lunghezza della linea di segnale (EMA dell'SMI).
- Ipercomprato / Ipervenduto: livelli di riferimento.
- Usa il timeframe del grafico / Timeframe di origine: calcolo opzionale su timeframe superiore.
Questo indicatore è progettato per essere leggero, stabile e pratico per flussi di lavoro di trading reali—sia che tu negozi la continuazione del trend, i range, o usi l'SMI come filtro di conferma all'interno di una strategia più ampia.
Riepilogo
The indicator plots three key elements: the main SMI momentum line, an EMA-based signal line for crossovers and confirmation, and reference levels for overbought, oversold, and the zero midpoint. Traders use the zero line as a directional filter to identify bullish or bearish pressure and trade pullbacks via SMI and signal line crossovers. It also supports mean-reversion strategies by signaling fades from overbought/oversold conditions and can highlight momentum divergences.
A multi-timeframe option allows calculation of the SMI from a higher timeframe while displaying it on the current chart, helping to filter noise and improve signal quality. User inputs include lookback lengths for %K and %D, signal line EMA length, overbought/oversold levels, and timeframe selection. The indicator is designed for use across various markets including Forex, stocks, commodities, indices, and cryptocurrencies.
Recensioni dei clienti
5 | 50 % | |
4 | 50 % | |
3 | 0 % | |
2 | 0 % | |
1 | 0 % |