
Descrizione
Stanco di passare un'eternità a segnare i tuoi grafici? Questo indicatore lo fa per te super velocemente.
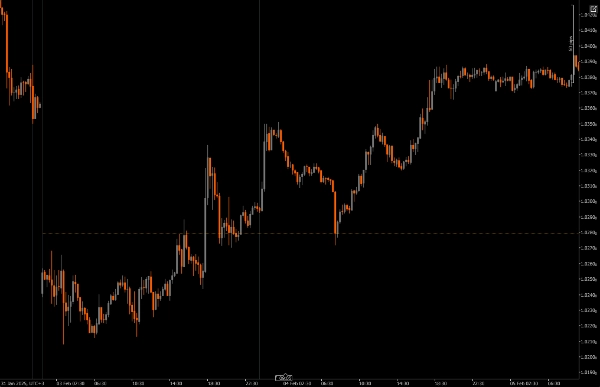
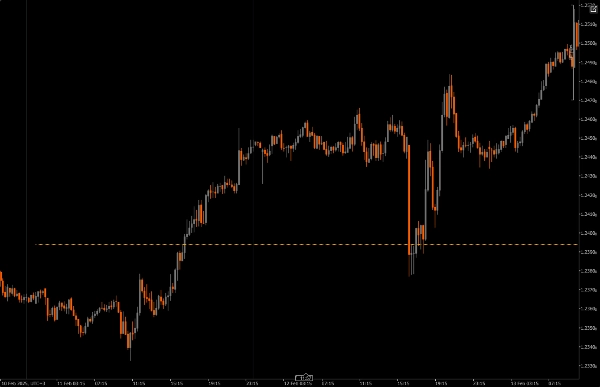
Trova il punto medio tra il massimo e il minimo del giorno precedente e lo traccia sui tuoi grafici. Ora puoi scansionare i tuoi grafici super velocemente. Facile facile!
Alcune caratteristiche interessanti
Intervallo di riferimento personalizzabile: puoi scegliere un intervallo minimo e massimo per tracciare livelli di prezzo significativi, il che aiuta ad allineare i tuoi trade intraday con le tendenze di mercato più ampie.
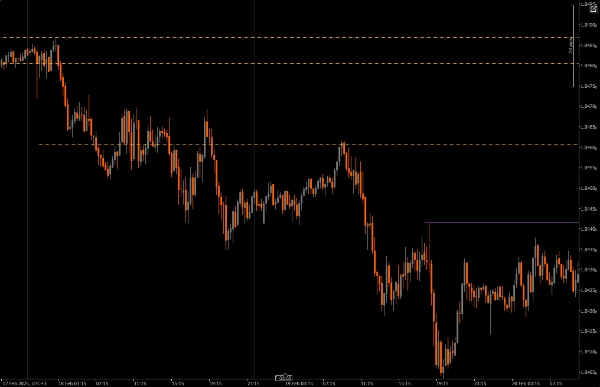
Ciò che rende speciale questo indicatore è la capacità di seguire la candela settimanale mentre si forma giorno per giorno, rendendo più facile cogliere l'espansione della candela settimanale.
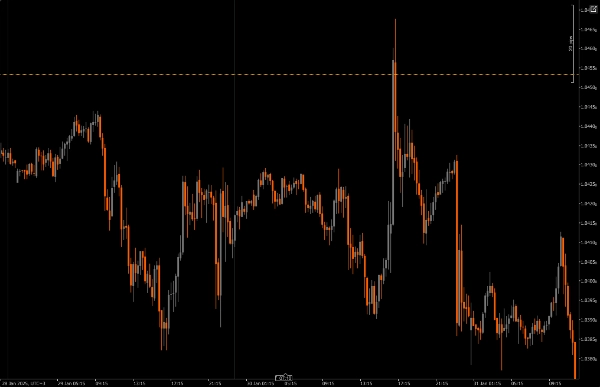
Parametro di offset: questa funzione ti permette di decidere quanto in avanti nel futuro si estendono i livelli tracciati, offrendoti un quadro più chiaro delle potenziali zone di continuazione del prezzo futuro.
Personalizzazione visiva: hai molte opzioni per modificare stili di linea, spessore e colori, rendendo facile creare un grafico che si adatti al tuo stile personale e sia facile da leggere.
Restrizioni di intervallo temporale: l'indicatore include controlli per assicurarsi che funzioni solo all'interno delle impostazioni di intervallo temporale specificate, così puoi evitare il sovraccarico di grafico mentre cambi tra altri intervalli.
Punti da notare:
Un preferito personale
Se sei come me e non riesci a stare lontano dal rossetto sui tuoi grafici, prova questo indicatore. Ha restrizioni di intervallo temporale e funzionalità di periodo di lookback mirate a ridurre il disordine sul grafico.
Questo indicatore è utile per seguire come si sviluppa la candela settimanale; se l'espansione settimanale mostra segni di un flusso di ordini rialzista, allora i livelli pivot di questo indicatore visualizzano aree o zone per unirsi all'espansione rialzista; similmente, se l'espansione settimanale mostra un flusso di ordini ribassista, allora i livelli pivot di questo indicatore visualizzano aree o zone per unirsi all'espansione ribassista.
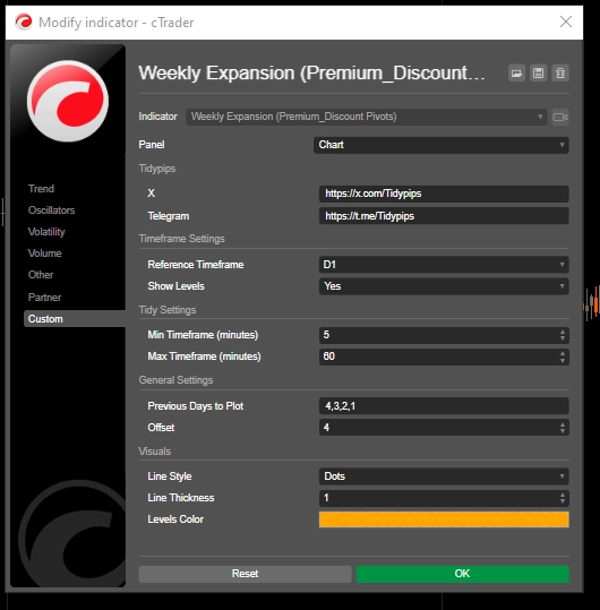
Installazione: inizia scaricando e installando il Previous Day Equilibrium sulla tua piattaforma cAlgo.
Configurazione: apri le impostazioni per scegliere il tuo intervallo di riferimento, seleziona quanti giorni precedenti vuoi tracciare e personalizza le impostazioni visive a tuo piacimento.
Analisi: mentre fai trading, tieni d'occhio i livelli tracciati sul tuo grafico. Questi livelli indicano dove il prezzo potrebbe invertire, basandosi sull'azione storica del prezzo, aiutandoti a prendere decisioni più informate.
Esecuzione: usa questi livelli per determinare i tuoi punti di ingresso e uscita, così come gli ordini di stop-loss e take-profit, integrandoli nella tua strategia di trading complessiva.
Strumenti consigliati da abbinare:
cTrader: questa è la migliore piattaforma per usare il Previous Day Equilibrium, offrendo un'esperienza fluida per personalizzazione e analisi.
Strumenti di analisi tecnica: abbina questo indicatore ad altri strumenti come medie mobili o oscillatori per ottenere una visione più completa delle tendenze di mercato.
Strumenti di gestione del rischio: utilizza calcolatori e strumenti di stop-loss per aiutarti a gestire efficacemente il rischio mentre fai trading intorno a questi livelli chiave.
Usando il Previous Day Equilibrium insieme a questi strumenti, puoi migliorare la tua strategia di trading e aumentare le tue possibilità di successo nel mondo frenetico del trading intraday.
Riepilogo
Recensioni dei clienti
5 | 0 % | |
4 | 100 % | |
3 | 0 % | |
2 | 0 % | |
1 | 0 % |


