
Descrizione
*GLI ORARI DI APERTURA SARANNO DIVERSI TRA LE CLASSI DI ASSET
*I VALORI ORARI PREDEFINITI SONO PER NQ/ES/YM (FUTURES)
*IL VALORE DELL'ORA DEVE ESSERE IN EASTERN STANDARD TIME (EST)
Caratteristiche principali:
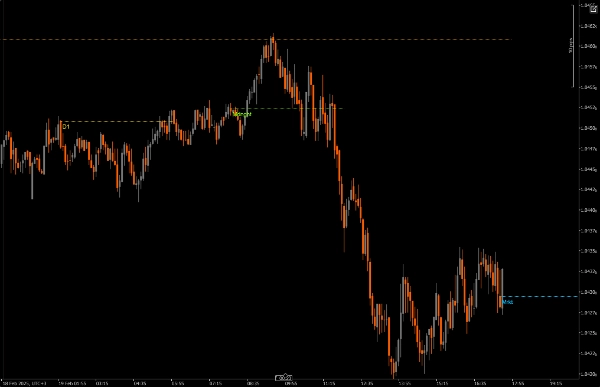
Livelli di prezzo basati sul tempo
Traccia linee di prezzo di apertura agli orari chiave del mercato
Tutti gli orari sono sincronizzati con l'Eastern Standard Time (EST)
Ogni periodo di tempo è codificato a colori per una facile identificazione
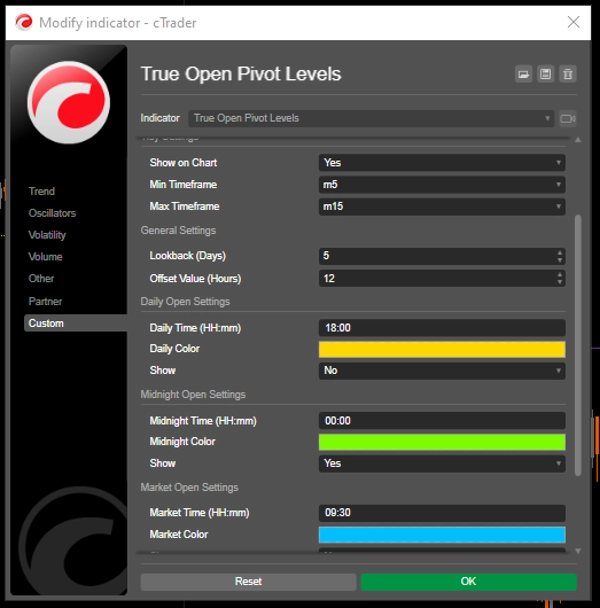
3 indicatori di sessione personalizzabili:
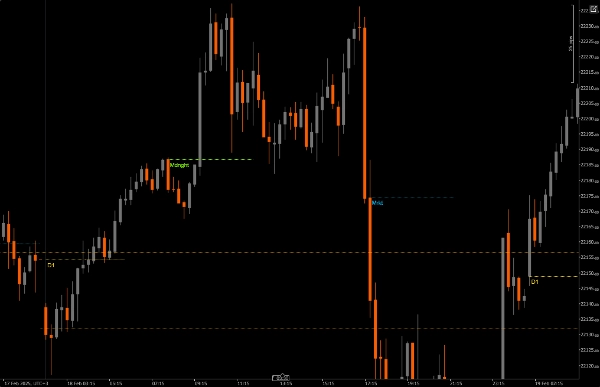
Apertura giornaliera (12:00 AM EST) - Oro predefinito
Apertura di mezzanotte (4:00 AM EST) - Verde predefinito
Apertura del mercato (9:30 AM EST) - Blu predefinito
Ogni sessione può essere attivata/disattivata indipendentemente
Personalizzazione visiva:
Spessore della linea regolabile
Molteplici stili di linea (solido, puntinato, tratteggiato)
Colori personalizzabili per ogni sessione
Etichette temporali opzionali che mostrano gli orari EST
Offset della linea configurabile fino a 48 ore
Supporto per intervalli di tempo flessibili:
Imposta intervalli di tempo minimi e massimi per la visualizzazione
Previene l'affollamento del grafico su intervalli di tempo inappropriati
Ottimizzato per intervalli M5-M15
Impostazioni temporali:
Tutti gli orari sono in EST
Personalizza gli orari delle sessioni per adattarli alla tua strategia di trading
Regola la durata della linea in base alle tue esigenze di analisi
Impostazioni visive:
Regola lo spessore della linea per la visibilità
Scegli lo stile della linea in base alla chiarezza del grafico
Abilita/disabilita le etichette secondo necessità
Personalizza i colori per adattarli al tema del tuo grafico
Impostazioni generali:
Definisci intervalli di tempo minimi/massimi
Regola la durata della linea per analisi estese
Buone pratiche:
Inizia con le impostazioni predefinite e regola in base alle tue esigenze
Usa colori diversi per ogni sessione per una chiara differenziazione
Considera di ridurre la durata della linea su intervalli di tempo inferiori per evitare l'affollamento
Abilita inizialmente le etichette per comprendere la tempistica, disabilitale se il grafico diventa troppo affollato
Adatta le impostazioni dell'intervallo temporale dell'indicatore al tuo intervallo di trading
Questo indicatore è particolarmente utile per:
Trader giornalieri focalizzati sui mercati USA
Trader che necessitano di monitorare le aperture delle sessioni
Coloro che operano intorno a eventi di mercato importanti
Trader che analizzano l'azione del prezzo multi-sessione
Chiunque necessiti di un riferimento visivo chiaro per gli orari di mercato EST
Riepilogo
Recensioni dei clienti
5 | 100 % | |
4 | 0 % | |
3 | 0 % | |
2 | 0 % | |
1 | 0 % |


