
Descrizione
MACD Custom MTF (Multiple Time Frame) v1.1 è uno strumento avanzato che fonde la potenza comprovata del classico MACD con il vantaggio cruciale dell'analisi multi-timeframe e una visualizzazione moderna e intuitiva. Progettato per trader esigenti che richiedono precisione, interpretazione rapida e la capacità di personalizzare gli strumenti in base alla propria strategia unica.
Novità nella Versione 1.1:
- Visualizzazione 100% Fluida: Risolti i problemi delle linee MACD interrotte/discontinue – le linee sono ora perfettamente continue durante i cambiamenti di tendenza.
- Migliore Visibilità: Aumentata la dimensione dei punti segnale Buy/Sell, ispessite la Linea Segnale e l'Istogramma per una visuale cristallina. La Linea Zero è stata attenuata per ridurre l'affaticamento visivo.
- Avvisi Intelligenti e Semplificati: Finestra delle impostazioni ripulita. Basta attivare "Buy Alert" o "Sell Alert" e l'indicatore gestisce automaticamente i popup sullo schermo e le notifiche sonore corrette.
- Impostazioni Organizzate: Tutti i parametri sono ora splendidamente raggruppati in categorie intuitive per un'esperienza utente molto migliore.
- Localizzazione Completa in Inglese: Tutti i messaggi di log, popup ed errori sono stati completamente localizzati in inglese.
Analisi Multi-Timeframe (MTF) su un Unico Grafico:
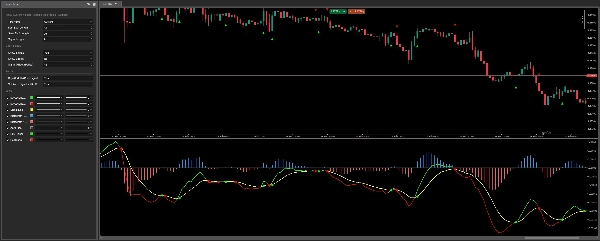
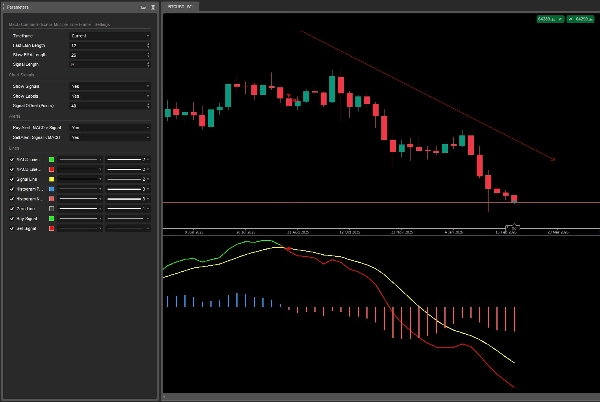
Basta saltare da un grafico all'altro! Visualizza i dati MACD da un timeframe superiore (es. H1, H4, D1) direttamente sul tuo grafico di lavoro attuale (es. M5, M15). Ottieni un contesto di mercato più ampio e prezioso, identifica le tendenze dominanti sottostanti e filtra efficacemente il rumore fuorviante dei timeframe inferiori. Completamente configurabile – scegli da un elenco completo di timeframe, dai minuti al mensile.
Colorazione Dinamica di MACD e Linea Segnale:
Conferma immediata della tendenza: la linea MACD cambia dinamicamente colore al suo incrocio con la linea segnale, illustrando vividamente il momentum rialzista o ribassista. Niente più congetture – il colore della linea indica immediatamente se il MACD è sopra (rialzista) o sotto (ribassista) la sua linea segnale.
Istogramma Cristallino:
Visualizza facilmente la divergenza (forza) tra il MACD e la sua linea segnale. L'indicatore colora intuitivamente le barre ispessite in base al fatto che siano positive (blu) o negative (rosse), fornendo un'intuizione profonda sui cambiamenti di momentum a colpo d'occhio.
Segnali di Incrocio Visivi Inconfondibili:
Non perdere mai più un incrocio critico! L'indicatore evidenzia automaticamente gli incroci tra MACD e linea segnale. Traccia punti distinti e altamente visibili direttamente sul grafico dei prezzi (con uno spostamento regolabile) e offre etichette testuali opzionali "Buy"/"Sell" per la massima chiarezza.
Avvisi Intelligenti Integrati:
Include notifiche popup e sonore integrate e senza complicazioni per segnali di acquisto e vendita. Rimani informato su ogni opportunità senza dover stare incollato allo schermo! Basta attivare gli avvisi nelle impostazioni e lasciare che l'indicatore faccia il lavoro per te.
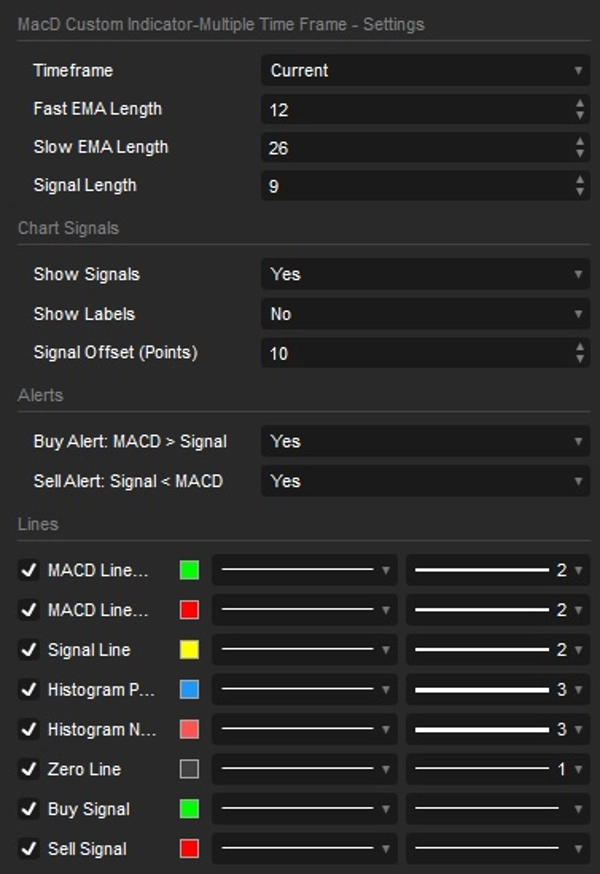
Personalizzazione Completa a Portata di Mano:
- Personalizza le lunghezze di EMA veloce, EMA lenta e linea segnale secondo le tue specifiche precise.
- Tutte le impostazioni sono organizzate ordinatamente in gruppi logici (Impostazioni MACD, Segnali Grafico, Avvisi) per regolazioni rapide.
- Attiva o disattiva la visibilità per singoli elementi visivi: linee MACD e Segnale, Istogramma, Segnali di Incrocio ed Etichette.
- Offset segnale regolabile per adattarsi perfettamente all'estetica e alle preferenze del tuo grafico.
Riepilogo
Key features include dynamic coloring of the MACD and signal lines to indicate bullish or bearish momentum, a crystal-clear histogram that visualizes the divergence between MACD and its signal line with color-coded bars, and unmistakable visual crossover signals marked by distinct dots or arrows on the price chart. The indicator supports integrated alerts with popup and sound notifications for buy and sell signals, configurable via a streamlined settings interface.
Users can fully customize the indicator by adjusting Fast EMA, Slow EMA, and Signal Line lengths, toggling visibility of visual elements (lines, histogram, signals, labels), and modifying colors and line thickness. The settings are organized into intuitive categories for ease of use. This indicator supports a wide range of timeframes from minutes to monthly and is suitable for various markets including Forex, indices, commodities, stocks, and cryptocurrencies.
Recensioni dei clienti
5 | 100 % | |
4 | 0 % | |
3 | 0 % | |
2 | 0 % | |
1 | 0 % |


