
LT_SmartSwings
Indicatore
6 acquisti
Versione 1.0, Jun 2025
Windows, Mac
5.0
Recensioni: 1
Descrizione
Nota: Testato solo su cTrader Windows.
LT_SmartSwings è un potente indicatore basato sulla struttura di mercato a swing progettato per aiutare i trader a visualizzare con chiarezza e flessibilità i punti di svolta chiave, i movimenti di mercato e gli eventi di breakout. Realizzato per precisione e adattabilità, questo strumento è ideale per i trader che si affidano alla logica degli swing, alla confluenza di Fibonacci e all'analisi dei breakout.
Caratteristiche principali:
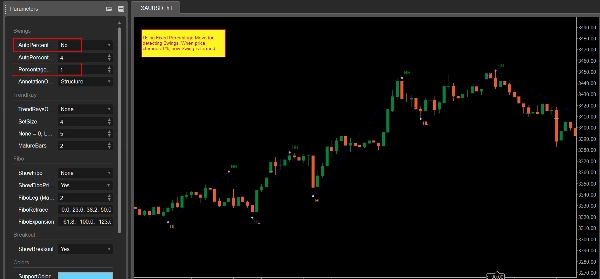
- Rilevamento Swing High/Low basato sulla percentuale di movimento del prezzo
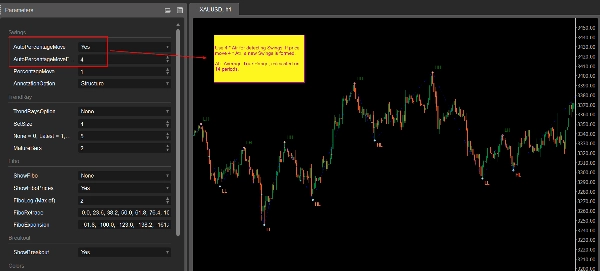
- Soglia Automatica o Manuale: Usa % fissa o modalità automatica (basata su ATR x fattore)
- Linea ZigZag che collega gli swing chiave
- Annotazioni Dettagliate con 5 modalità:
-
- Struttura: HH, HL, LH, LL
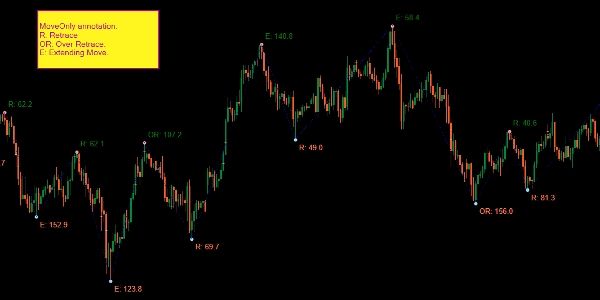
- Solo Movimento: percentuali di Ritracciamento (R) ed Estensione (E)
- Solo Prezzo
- Movimento e Prezzo
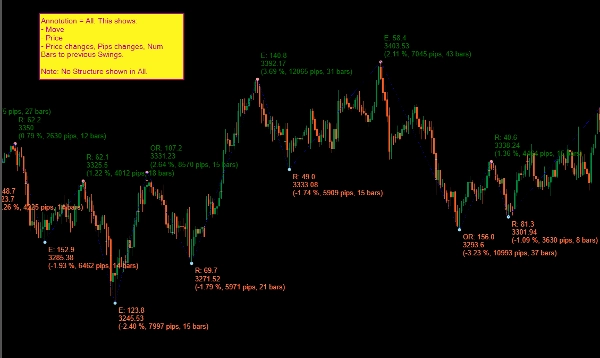
- Tutto: %, pips, barre, prezzo, tipo di movimento
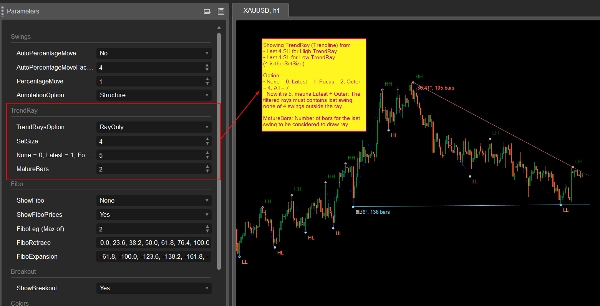
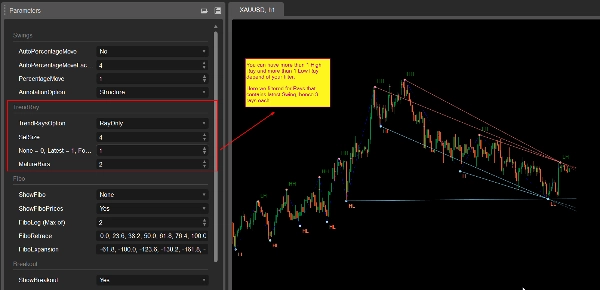
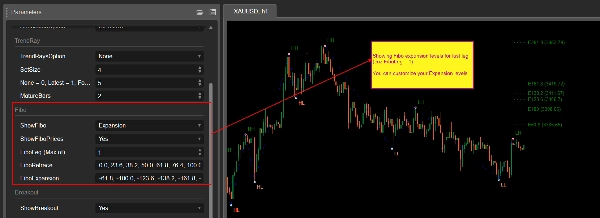
- Proiezione Raggio di Tendenza (con molteplici opzioni di filtro):
-
- Disegna raggi dagli swing recenti usando vincoli intelligenti
- Opzioni: Ultimo, Focus (pendenza), Esterno o Tutti
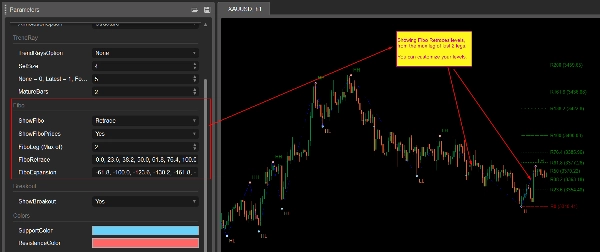
- Livelli di Fibonacci Automatici:
-
- Disegna livelli di ritracciamento o espansione basati sui movimenti recenti
- Set di livelli configurabili dall'utente
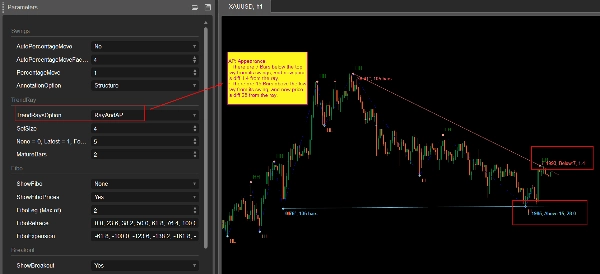
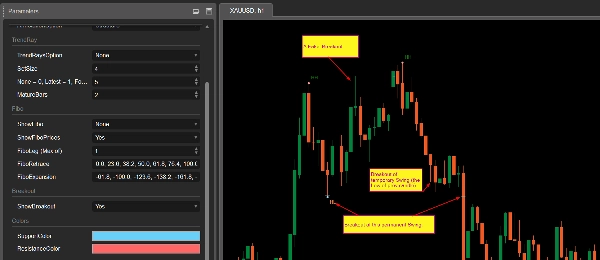
- Marcatura del Breakout:
-
- Rileva il breakout dei punti swing (sia confermati che falsi breakout)
- Visualizzazione persistente per riferimento storico
- Personalizzazione Colori per linee di supporto/resistenza
Casi d'uso:
- Identificare dinamicamente supporto/resistenza
- Comprendere la struttura degli swing e le transizioni
- Individuare la continuazione o inversione del trend usando i Fibonacci
- Visualizzare i punti di breakout per la pianificazione del trade
- Combinare con i tuoi sistemi esistenti o strategie discrezionali
Uso consigliato:
- Applicare al tuo timeframe di lavoro (es. M30, H1)
- Ideale per trader manuali, analisti di struttura e strategie basate su conferme
Offerta di lancio: Disponibile ora a soli 15$!
Riepilogo
Riepilogo AI
LT_SmartSwings is a swing-based market structure indicator designed for traders to identify key turning points, market moves, and breakout events with precision and flexibility. It detects swing highs and lows based on price movement percentage, using either fixed or automatic thresholds derived from ATR. The indicator connects key swings with a ZigZag line and provides detailed annotations in five modes, including structure (HH, HL, LH, LL), move percentages, price-only, combined move and price, and comprehensive move data.
Additional features include trend ray projection with multiple filtering options, automatic Fibonacci retracement and expansion levels customizable by the user, and breakout marking that detects both confirmed and false breakouts with persistent historical display. Support and resistance lines can be color-customized.
Use cases cover dynamic support/resistance identification, understanding swing structure and transitions, spotting trend continuation or reversal via Fibonacci levels, visualizing breakout points for trade planning, and integration with existing trading systems or discretionary strategies. It is recommended for manual traders, structure analysts, and confirmation-based strategies, and is intended for use on working timeframes such as M30 or H1. The indicator has been tested on cTrader Windows.
Profilo indicatore
Recensioni dei clienti
5.0
Recensioni: 1
5 | 100 % | |
4 | 0 % | |
3 | 0 % | |
2 | 0 % | |
1 | 0 % |
Discussioni
Domande frequenti
Breakout
ATR
I prodotti disponibili tramite cTrader Store, inclusi bot di trading, indicatori e plugin, sono forniti da sviluppatori terzi e resi disponibili esclusivamente a scopo informativo e di accesso tecnico. cTrader Store non è un broker e non fornisce consulenze in materia di investimento, raccomandazioni individualizzate o garanzie di risultati futuri.


Prezzo
Da 25/09/2024
34
Vendite