

LT_Ind_SRZones
Indikator
5 käufe
Version 1.0, Oct 2025
Windows, Mac
4.5
Bewertungen: 6

Seit 25/09/2024
38
Verkäufe
Beschreibung
Hinweis: Getestet nur auf cTrader Windows.
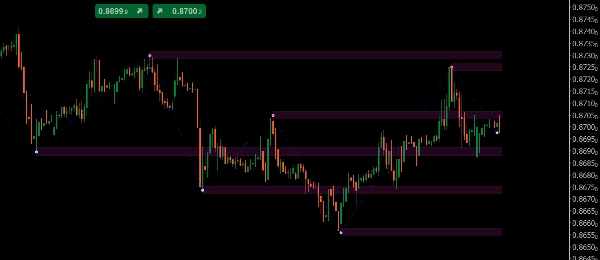
LT_Ind_SRZones erkennt Swing-Hochs/-Tiefs, fasst nahegelegene Swings zu Support-/Resistance-Zonen zusammen und hält Ihr Chart auf die relevantesten Niveaus rund um den aktuellen Preis fokussiert.
Was es zeichnet
- Zonen: schattierte Bereiche, die aus zusammengefassten Swings gebildet werden
- Swing High/Low Punkte
- ZigZag Pfad für schnelles Strukturlesen
Wichtige Steuerungen
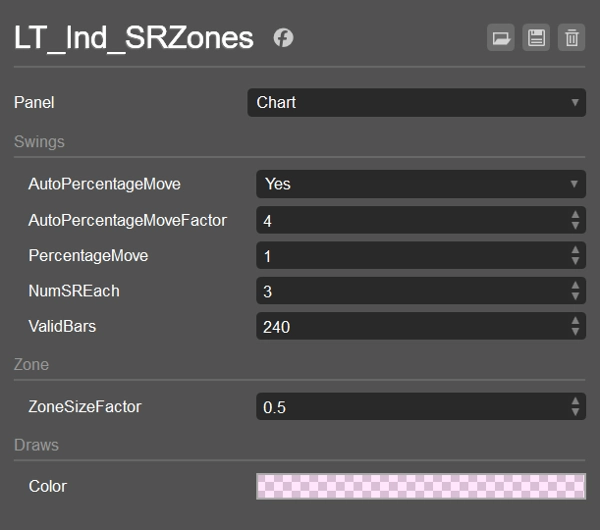
- AutoPercentageMove (bool) + AutoPercentageMoveFactor (double)
Automatische Feinabstimmung der Swing-Empfindlichkeit. Ausschalten, um PercentageMove manuell zu verwenden. - PercentageMove (double)
Minimale Bewegung (in %) zur Bildung eines Swings, wenn Auto aus ist. - ZoneSizeFactor (double)
Zonenhöhe =ZoneSizeFactor × ATR. - NumSREach (int)
Wie viele Top-Zonen oberhalb und unterhalb des aktuellen Preises behalten werden. - ValidBars (int)
Ignoriere Swings, die älter als diese Anzahl von Bars sind. - Farb- / Anzeige-Stile
Füllfarbe der Zone (mit Alpha), Swing/ZZ-Stile.
Sortier- & Filterlogik (wie Zonen ausgewählt werden)
- Swings sammeln von den neuesten rückwärts, nur permanente und nicht älter als
ValidBars. - Zähle Swings oberhalb und unterhalb des aktuellen Preises (einschließlich derjenigen, deren Wert innerhalb einer halben Zone liegt). Stoppe, wenn beide Seiten
NumSREacherreicht haben. - Fallback: falls eine Seite keinen berechtigten Swing hat, füge einen älteren Swing für diese Seite hinzu.
- Zusammenführen: für jeden berechtigten Swing entweder zusammenführen in eine bestehende Zone (
CanMerge) oder erstellen einer neuen Zone. - Bewerten & auswählen:
-
- Oberhalb des Preises: sortiere Zonen nach (Hoch − Preis) aufsteigend, dann nach MostRecentIndex absteigend; nimm
NumSREach. - Unterhalb des Preises: sortiere nach (Preis − Tief) aufsteigend, dann nach MostRecentIndex absteigend; nimm
NumSREach. - Vereinigung der beiden Listen → finale angezeigte Zonen.
- Oberhalb des Preises: sortiere Zonen nach (Hoch − Preis) aufsteigend, dann nach MostRecentIndex absteigend; nimm
Dies hält die Anzeige sauber, nah und aktuell, während es dennoch Randfälle behandelt.
Standardwerte
- AutoPercentageMove = true, AutoPercentageMoveFactor = 4
- PercentageMove = 1.0 (verwendet, wenn Auto = false)
- NumSREach = 1
- ValidBars = 240
- ZoneSizeFactor = 0.5 (Zonenhöhe = 0.5 × ATR)
- Zonenfarbe = #21FF33E0 (halbtransparent)
- Swing High = #FFFF999A, Swing Low = #FF99DFF9, ZigZag = Blau (Punkte)
Anwendungsfälle
- Markiere nahegelegene S/R-Zonen für Einstiege, Teilverkäufe oder Stops
- Beobachte Zonenwechsel (Support → Resistance und umgekehrt)
- Kombiniere mit VWAP/Pivots für Konfluenz
Funktioniert mit jedem Symbol und Zeitrahmen. Leichtgewichtig und bereit für Live-Trading oder Backtests.
Zusammenfassung
AI summary
LT_Ind_SRZones is an indicator designed for cTrader Windows that automatically identifies and displays support and resistance zones derived from swing highs and lows. It detects swing points, merges nearby swings into shaded support/resistance zones, and highlights the most relevant levels around the current price to maintain a clear chart view. The indicator also plots swing high/low points and a ZigZag path for quick structural analysis.
Key adjustable parameters include automatic or manual swing sensitivity settings, zone size based on a factor of the Average True Range (ATR), the number of top zones to display above and below the current price, and the maximum age of swings considered. The indicator filters and ranks zones by proximity and recency, ensuring the display focuses on recent and nearby levels.
LT_Ind_SRZones works on any symbol and timeframe, supporting markets such as Forex, indices, commodities, cryptocurrencies, and stocks. It is suitable for live trading and backtesting. Typical use cases include marking nearby support/resistance zones for trade entries, stops, or partial exits, monitoring zone flips (support to resistance and vice versa), and combining with other indicators like VWAP or pivots for confluence.
Key adjustable parameters include automatic or manual swing sensitivity settings, zone size based on a factor of the Average True Range (ATR), the number of top zones to display above and below the current price, and the maximum age of swings considered. The indicator filters and ranks zones by proximity and recency, ensuring the display focuses on recent and nearby levels.
LT_Ind_SRZones works on any symbol and timeframe, supporting markets such as Forex, indices, commodities, cryptocurrencies, and stocks. It is suitable for live trading and backtesting. Typical use cases include marking nearby support/resistance zones for trade entries, stops, or partial exits, monitoring zone flips (support to resistance and vice versa), and combining with other indicators like VWAP or pivots for confluence.
Indikatorprofil
Kundenbewertungen
4.5
Bewertungen: 6
5 | 50 % | |
4 | 50 % | |
3 | 0 % | |
2 | 0 % | |
1 | 0 % |
Kundenbewertungen
October 26, 2025
Good enough to keep watching for another week. A clean signal can still fail.
October 25, 2025
The logic holds up when bad setups become easier to pass on. It works better with a written plan.
October 22, 2025
October 15, 2025
the routine feels easier to keep, but the chart still needs a human read.
Diskussion
Häufig gestellte Fragen (FAQ)
Prop
Forex
Indices
Commodities
Crypto
Stocks
Über den cTrader Store verfügbare Produkte, einschließlich Handelsbots, Indikatoren und Plugins, werden von externen Entwicklern bereitgestellt und nur zu Informations- und technischen Zugriffszwecken verfügbar gemacht. cTrader Store ist kein Broker und erbringt keine Anlageberatung, persönlichen Empfehlungen oder eine Garantie für zukünftige Performance.

























Preis
Seit 25/09/2024
38
Verkäufe