
Trend Cycle
Indikator
181 muat turun
Versi 1.0, Nov 2025
Windows, Mac
Penerangan
Trend Cycle adalah alat analitik tren yang memfokuskan pada tempoh tren, bukan hanya arah.
Ia:
- Mengesan tren menaik dan tren menurun berdasarkan cerun Purata Pergerakan Hull (HMA).
- Mengira berapa banyak bar tren semasa telah aktif (Panjang Sebenar).
- Menyimpan panjang tren menaik dan tren menurun secara berasingan.
- Mengira purata panjang tren menaik dan menurun (Purata Bull / Purata Bear).
- Melukis:
-
- Sebuah HMA hijau semasa tren menaik dan HMA merah semasa tren menurun.
- Garis unjuran mendatar pada permulaan setiap tren, dengan label seperti
PL: 18(Panjang Mungkin dalam bar). - Sebuah label langsung berhampiran harga semasa yang menunjukkan arah tren dan Panjang Sebenar.
- Sebuah panel paparan dengan:
-
- purata tempoh tren menaik dan menurun,
- senarai panjang tren terkini (sehingga saiz sampel yang dipilih).
Matlamatnya adalah untuk membantu anda menjawab:
“Berapa lama tren ini, dan berapa lama tren seperti ini biasanya bertahan?”
Bagaimana ia berfungsi (logik)
- Purata Pergerakan Hull (HMA)
Penunjuk mengira Purata Pergerakan Hull harga penutupan menggunakan parameter Panjang Pelicinan HMA.
HMA lebih lancar daripada simple/EMA tetapi bertindak balas dengan cepat terhadap perubahan arah. - Pengesanan tren melalui cerun
Sepanjang Sensitiviti Pengesanan Tren bar terakhir, ia memeriksa HMA:
Selagi tren ditakrifkan, pemasa (Panjang Sebenar) ditambah setiap bar, mewakili tempoh tren semasa. -
- Jika HMA telah menaik dengan ketat → tren adalah menaik (↑).
- Jika HMA telah menurun dengan ketat → tren adalah menurun (↓).
- Jika tidak, ia mengekalkan keadaan tren sebelumnya.
- Merekod panjang tren
Apabila tren bertukar dari menaik ke menurun atau sebaliknya: -
- Tempoh tren yang telah selesai disimpan:
-
- tren menaik ke dalam senarai menaik,
- tren menurun ke dalam senarai menurun.
- Setiap senarai dihadkan oleh Saiz Sampel Tren (contohnya 10 tren terakhir).
- Sampel ini digunakan untuk mengira:
-
- Purata Bull = purata panjang tren menaik.
- Purata Bear = purata panjang tren menurun.
- Unjuran Panjang Mungkin
Pada permulaan setiap tren baru, jika terdapat cukup sampel:
Unjuran ini disimpan pada carta sebagai sejarah supaya anda dapat membandingkan secara visual jangkaan vs tempoh tren sebenar. -
- Ia mengira purata panjang untuk jenis tren tersebut (menaik atau menurun).
- Melukis garis mendatar dari bar permulaan tren untuk kira-kira sebanyak bar tersebut.
- Meletakkan label di tengah garis:
-
PL: X→ Panjang Mungkin = X bar.
- Label langsung
Pada setiap bar, penunjuk melukis satu label langsung berhampiran HMA:
Ini menunjukkan arah tren semasa dan tepat berapa banyak bar ia telah bertahan setakat ini. -
- Contoh teks:
-
Trend ↑
Panjang Sebenar: 7
- Warna:
-
- Hijau (↑) untuk tren menaik
- Oren/merah (↓) untuk tren menurun
- Panel paparan (bawah kiri)
Apabila Tunjukkan Panel Paparan diaktifkan, panel teks statik muncul di sudut carta yang menunjukkan:
Ini berfungsi sebagai gambaran statistik cepat tentang tingkah laku tren terkini pada simbol/jangka masa tersebut. -
- Tajuk: Trend Cycle
Purata Bull: X barPurata Bear: Y barSampel Bull:senarai panjang tren menaik terkiniSampel Bear:senarai panjang tren menurun terkini
Cara membacanya dalam praktik
- HMA Hijau + “Trend ↑”
→ Tren menaik sedang aktif.
→Panjang Sebenarmemberitahu anda berapa banyak bar ia telah bertahan setakat ini.
→ GarisPL: Xyang paling baru memberi anda gambaran visual tentang berapa lama tren menaik serupa biasanya berlangsung. - HMA Merah + “Trend ↓”
→ Tren menurun sedang aktif.
→Panjang Sebenar= umur tren menurun semasa.
→ Bandingkan Panjang Sebenar denganPurata Beardalam panel untuk melihat sama ada pergerakan itu muda atau matang. - Apabila Panjang Sebenar menghampiri atau melebihi purata (Purata Bull / Purata Bear):
→ Tren semasa secara statistik “lama” berbanding sejarah terkini.
→ Anda mungkin memilih untuk: -
- mengetatkan hentian,
- mengunci keuntungan,
- lebih berhati-hati dengan kemasukan baru dalam arah itu.
- Tren pendek vs tren panjang
-
- Banyak tren sangat pendek → persekitaran bergelombang / kembali ke purata.
- Beberapa tren panjang → pasaran lebih berarah, dengan pergerakan yang berpanjangan.
Ringkasan
Ringkasan AI
Trend Cycle is a technical indicator designed to analyze trend duration in financial markets. It detects bullish and bearish trends by evaluating the slope of a Hull Moving Average (HMA) applied to closing prices, providing a smoother yet responsive measure of trend direction. The indicator counts the number of bars the current trend has been active (Real Length) and records the lengths of recent up-trends and down-trends separately. Using these samples, it calculates average durations for bullish and bearish trends.
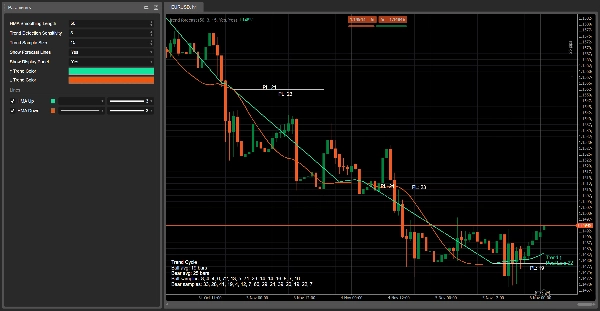
Visual elements include a green HMA line during bullish trends and a red HMA line during bearish trends. Horizontal projection lines mark the probable length of each trend at its start, labeled with "PL: X" to indicate expected duration in bars. A live label near the current price displays the active trend direction and its age in bars. An optional display panel offers a summary of average trend durations and recent trend length samples.
Trend Cycle helps users assess how long the current trend has lasted relative to historical trends, aiding decisions such as adjusting stops or managing entries. It supports analysis across various markets including Forex, cryptocurrencies, indices, commodities, and stocks.
Profil indikator
Ulasan pelanggan
0.0
Ulasan: 0
Ulasan pelanggan
Belum ada ulasan untuk produk ini. Anda sudah mencuba produk tersebut? Jadilah yang pertama untuk berkongsi pendapat anda!
Perbincangan
Soalan Lazim
BTCUSD
Forex
Signal
Breakout
Indices
EURUSD
Commodities
GBPUSD
NZDUSD
Martingale
Bollinger
Prop
ZigZag
Scalping
Supertrend
Crypto
Grid
Stocks
AI
XAUUSD
NAS100
USDJPY
Produk yang tersedia melalui cTrader Store, termasuk bot dagangan, indikator dan plugin, disediakan oleh pembangun pihak ketiga dan diberikan akses untuk tujuan maklumat dan teknikal sahaja. cTrader Store bukan broker dan tidak memberikan nasihat pelaburan, syor peribadi atau sebarang jaminan prestasi masa hadapan.


Harga
42.11M
Volum yang didagangkan
6.13M
Pip dimenangi
230
Jualan
8.52K
Pemasangan percuma