
Descrizione
QX Heatmap Scanner è un pannello heatmap compatto, integrato nel grafico, che ti aiuta a scansionare più simboli e timeframe in pochi secondi. Riassume la Direzione, Forza e la Volatilità in un punteggio chiaro per cella, così puoi dare priorità alle migliori condizioni ed evitare setup di bassa qualità.
Cosa vedi
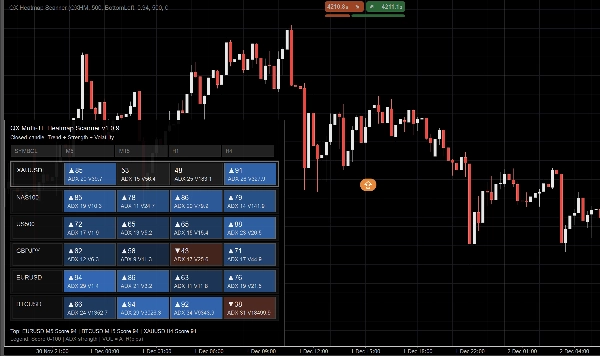
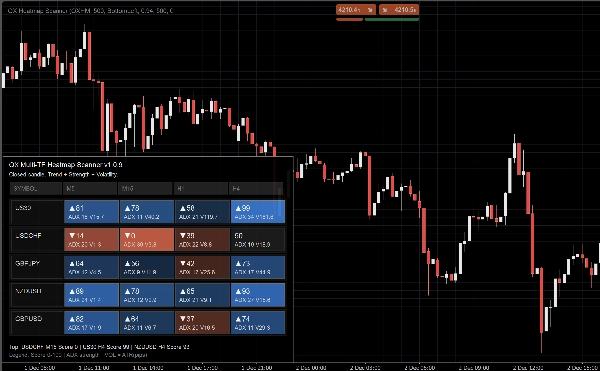
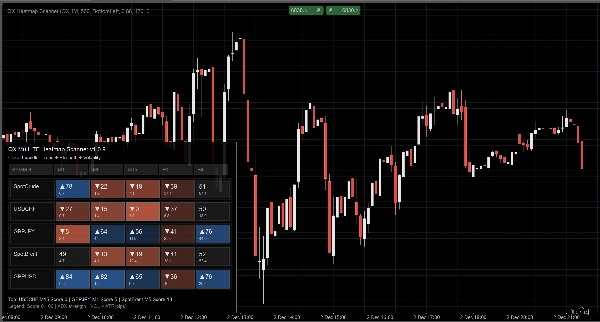
Ogni cella (Simbolo × Timeframe) mostra:
- Punteggio (0–100) con indicatore direzionale (▲/▼ quando sbilanciato)
- ADX valore (contesto di forza)
- VOL valore (contesto di volatilità)
L'intensità del colore riflette la convinzione. Il layout rimane leggibile anche con molti timeframe.
Modalità di visualizzazione
- Auto: si adatta alla larghezza disponibile della cella
- Completa: massimo dettaglio
- Compatta: ottimizzata per più timeframe mantenendo ADX e VOL visibili
- Minimale: layout ultra-compatto per schermi piccoli
Perché è utile
- Contesto top-down più rapido prima degli ingressi
- Confronto rapido tra mercati senza aprire molti grafici
- Decisioni più chiare evidenziando condizioni più forti
Prestazioni e stabilità
- Progettato per aggiornarsi su candele chiuse per segnali più puliti e meno rumore
- Throttle di aggiornamento (ms) per controllare l'uso della CPU
- Gestione difensiva per simboli mancanti o dati insufficienti
Caratteristiche principali
- Pannello heatmap multi-simbolo, multi-timeframe
- Punteggio 0–100 per cella con indicazioni di direzione chiare
- ADX e VOL visualizzati in modo coerente
- Angolo, larghezza, opacità e font del pannello regolabili
- Personalizzazione colori (rialzista/ribassista/neutrale + gamma di intensità)
Parametri chiave
Simboli (CSV), Timeframe (CSV), Densità di visualizzazione, Larghezza/Angolo/Opacità del pannello, Mostra VOL, Dimensioni dei font, Throttle di aggiornamento.
Nota: Questo strumento fornisce il contesto di mercato. Non è un sistema di trading automatico e non sostituisce la gestione del rischio.
Riepilogo
The panel supports various display modes—Auto, Full, Compact, and Minimal—allowing customization for different screen sizes and detail preferences. Users can adjust panel position, width, opacity, fonts, and color schemes for bullish, bearish, and neutral conditions.
QX Heatmap Scanner updates on closed candles to reduce noise and includes an update throttle feature to manage CPU usage. It handles missing symbols or insufficient data defensively to maintain stability.
Key features include quick top-down market context, cross-market comparison without multiple charts, and highlighting of stronger trading conditions. It supports symbols such as BTCUSD, EURUSD, GBPUSD, and markets including Forex, Crypto, Stocks, Commodities, and Indices. Parameters like symbols, timeframes, display density, and update throttle are user-configurable.
This tool provides market context to assist decision-making but does not execute trades or replace risk management.
Recensioni dei clienti
5 | 33 % | |
4 | 67 % | |
3 | 0 % | |
2 | 0 % | |
1 | 0 % |


